


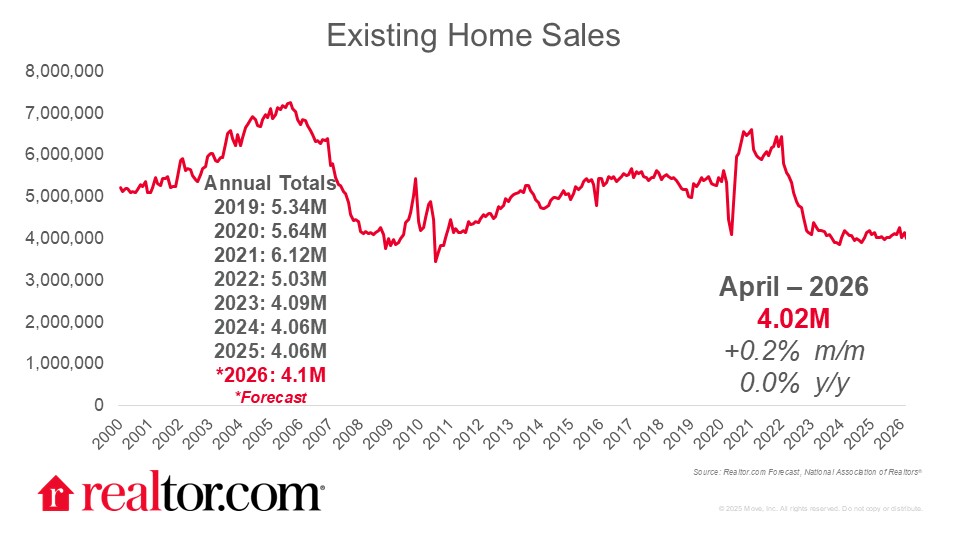
April 2026 existing-home sales
Existing home sales steadied in April after an upward revision in March data that suggests the annual pace of home sales has held just above 4 million this spring. Existing-home sales edged up 0.2% to a 4.02M pace in April from the upwardly revised March (now 4.01 vs. 3.98M original), and matched the prior year pace. In April, single-family home sales were once again, just 0.3% shy of their prior year pace (3.64M vs. 3.65M), but this time condos managed a small gain, rising 2.7% from both the prior month and year.
Pending sales suggest reasons to be cautiously optimistic
Pending home sales edged up in March from the prior month nationwide, although regional trends varied. Conflict in the Middle East has battered mortgage rates, affecting buyers and sellers nationwide. However, local economic factors, including housing supply and demand conditions mean that each region has responded uniquely.
Looking ahead, there are reasons to be cautiously optimistic for housing in the rest of 2026. One reason for caution is that even as the conflict in the Middle East fades, mortgage rates seem likely to remain higher than we originally expected heading into 2026. Nonetheless, we can be optimistic about a home sales pace that continues to hover right around 4 million despite these rate headwinds. Furthermore, the housing affordability picture is improving from the prior year, if only very gradually. Put simply, some homebuyers and sellers are moving forward with plans, and data suggest that others are waiting in the wings, should conditions improve further.
National home prices continue to edge higher amid regional variation
Home sales prices rose, with the median price climbing 0.9% from a year ago to $417,700. The typical U.S. asking price has been softer, in 2026, registering lower than the prior year in each month through April. Data on price cuts suggest that in some regions softer upfront pricing has been effective.
In the South and West, where asking prices have slipped further, buyers see fewer price cuts than in the prior year, although price cuts in these regions remain more common than they were prior to the pandemic, while the Midwest and the Northeast see the opposite trends. Data on sales prices show similar trends with the strongest price growth in the Northeast (+4.8%) and Midwest (+3.6%). The median sales price in the South had a much smaller 0.4% increase while the typical price in the West slipped (-1.4%), according to the NAR data.
Regional variation emphasizes the importance of using local data and expertise
Nationwide, months supply data from NAR suggests that the U.S. housing market remains relatively balanced. At 4.4 months of supply, buyers have a good number of options to choose from relative to the current pace of sales, keeping pricing relatively steady nationwide. But the steady national picture masks a wide array of local conditions revealed upon closer examination.
In fact, a report on the new Realtor.com Market Clock shows that buyers and sellers are facing one of the most fragmented housing markets in years. In this environment, shoppers need localized information in order to make well-informed decisions. The Realtor.com Market Clock helps buyers understand the local picture and pairs well with the guidance and advice of a local-expert Realtor agent.

