


Highlights
- April 2026 marks the 33rd consecutive month of year-over-year decline for 0-2 bedroom properties across the 50 largest metros. The national median asking rent fell $29, or 1.7%, compared to a year ago.
- The median asking rent in the 50 largest metros registered at $1,673, $92 (-5.2%) lower than its summer 2022 peak but $254 (17.9%) higher than the pre-pandemic level.
- Median rent declined in all size categories: studio: $1,408, down $28 (-1.9%) year over year; 1-bed: $1,565, down $25 (-1.6%) year over year; 2-bed: $1,862, down $36 (-1.9%) year over year.
- The multifamily housing pipeline continues to show signs of resilience. If current trends persist throughout an entire year, the rental housing stock is expected to increase 0.8% to over 50.5 million units by 2027Q1, reaching a level that is 8.5% higher than the pre-pandemic rental stock.
- Regionally, the Northeast stands out with the highest growth in both starts and completions. If current trends persist, the rental stock will increase the most in the Northeast (1.1%) by 2027Q1, followed by the South (0.9%), Midwest (0.7%), and West (0.7%).
In April 2026, the U.S. median rent recorded its 33rd consecutive year-over-year decline. Rent for 0-2 bedroom properties across the 50 largest metropolitan areas dropped by 1.7% compared to the previous year, with the median asking rent at $1,673—$29 lower than the prior year.
While the median asking rent remains $254 (17.9%) above pre-pandemic levels recorded in April 2019, it has fallen $92 (-5.2%) from its August 2022 peak. This persistent softness is increasingly translating into real savings for renters navigating a market that once felt out of reach.
As we enter the spring season, we expect the median asking rent to tick up on a monthly basis—a typical seasonal pattern. However, given the surge in multifamily construction over the past few years, we anticipate continued year-over-year declines. In other words, modest rent relief is likely to continue in 2026.
All unit sizes saw rent declines
In April 2026, the median asking rent for two-bedroom units dropped 1.9% year over year, marking the 35th consecutive month of annual declines. At $1,862, the national median rent for two-bedroom units now sits $107 (-5.4%) below its July 2022 peak. Despite this extended period of softness, two-bedroom rents remain $303 (19.4%) above their level seven years ago.
The rent for one-bedroom units slipped 1.6% in April 2026 on a year-over-year basis, standing at $1,565. This was the 35th consecutive month of annual declines. Rent was $95 (-5.7%) lower than the peak in August 2022, but still $236 (17.8%) higher than in April 2019.
In April 2026, the median asking rent for studios fell by 1.9%, marking the 32nd consecutive month of annual declines. The median rent of studios was $1,408 in April, down by $78 (-5.2%) from its peak in October 2022. Nevertheless, the median asking rent for studios was still $200 (16.6%) higher than seven years ago.
Table 1: National Rents by Unit Size, April 2026
| Unit Size | Median Rent | Rent YoY | Consecutive Months of Decline | Total Decline From Peak | Rent Change – 7 Years |
| Overall | $1,673 | -1.7% | 33 | -5.2% | 17.9% |
| Studio | $1,408 | -1.9% | 32 | -5.2% | 16.6% |
| 1-Bedroom | $1,565 | -1.6% | 35 | -5.7% | 17.8% |
| 2-Bedroom | $1,862 | -1.9% | 35 | -5.4% | 19.4% |
Rising multifamily starts signal a new wave of rental supply on the horizon
The median asking rent has been on a consecutive year-over-year decline for nearly three years. An important question is how much longer this trend will persist. In this report, we examine the supply side of the equation.
The multifamily housing pipeline continues to show signs of resilience. In 2026Q1, units in multifamily buildings under construction averaged 684,000 on a seasonally adjusted annual rate (SAAR) basis—down from 765,000 in 2025Q1 and the peak of 971,000 in 2024Q1, yet still 11.4% above the pre-pandemic baseline of 614,000 (Q1 average, 2017–19). This suggests that while the construction boom is unwinding, the pipeline remains meaningfully elevated by historical standards, and a steady stream of new rental supply should continue reaching the market in the near term.
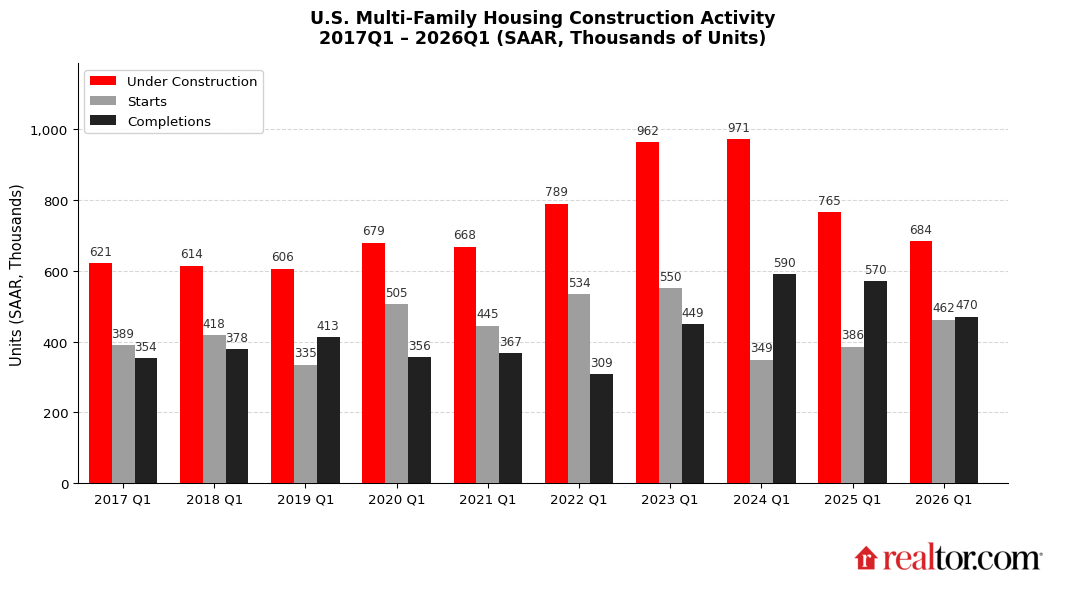
Table 2: Rising Multifamily Starts Signal a New Wave of Rental Supply on the Horizon
| 2026Q1 | 2025Q1 | Avg. Q1 of 2017–19 | % Change vs. 2025Q1 | % Change vs. pre-pandemic | |
| Under Construction | 684,000 | 765,000 | 614,000 | -10.6% | 11.4% |
| Starts | 462,000 | 386,000 | 381,000 | 19.7% | 21.3% |
| Completions | 470,000 | 570,000 | 382,000 | -17.5% | 23.0% |
On the completion side, the 2026Q1 SAAR of 470,000 units reflects a similar pattern. The figure trails both the 2024Q1 reading of 590,000 and the 570,000 recorded in 2025Q1, consistent with the broader drawdown in units under construction over the same period. Nevertheless, completions remain approximately 23% above the 2017–19 average of 382,000, indicating that delivery activity continues to outperform pre-pandemic norms.
Given the year-over-year decline in the number of new multifamily units under construction, we don’t expect the annual completion rate observed in 2026Q1 to persist throughout the entire year. However, a conservative estimate could be made by assuming a constant delivery ratio between units under construction and completed units, in order to calculate a hypothetical annual completion rate for 2027Q1. Specifically, under this assumption, we can anticipate 420,000 additional units, a 0.8% growth in the rental housing stock to over 50.5 million units by 2027Q1 across the U.S., a level that is 8.5% higher than the pre-pandemic rental stock.
The most notable development in 2026Q1 is the reacceleration in multifamily starts, which surpassed levels recorded in both of the prior two years and 21.3% higher than the pre-pandemic level. If sustained, this uptick in groundbreakings could have meaningful implications for rental supply over the 12- to 24-month horizon.
Northeast stands out as West slips behind pre-pandemic levels
Regionally, all four regions recorded year-over-year declines in multifamily units under construction in 2026Q1. The West saw the steepest contraction at -14.7%, followed by the South (-11.1%), the Northeast (-7.1%), and the Midwest (-5.4%). Nevertheless, three of the four regions remain well-above their pre-pandemic norms, but the West has fallen below its historical baseline by 4.4%.
Table 3: Northeast Sees the Highest YoY Growth in Starts and Completions
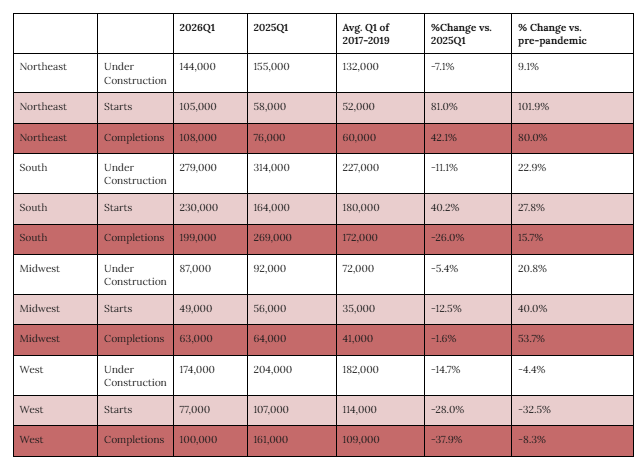
On the completion front, the Northeast stands out. Despite the broad-based pullback in units under construction, the Northeast posted a 42.1% year-over-year surge in completed units—the only region to record growth—suggesting that renters there may finally begin to feel some relief. The surge in rental completions across the Northeast has meaningfully expanded supply, putting downward pressure on asking rents. In April 2026, Boston, MA (-2.9%), and Philadelphia, PA (-1.5%), both posted year-over-year rent declines—a sign that supply is outpacing demand in those markets. New York City, however, remains subject to tight supply-demand dynamics, with rents still edging up 1.1% year over year. By contrast, the West is the only region where the annual rate of completions has fallen below its pre-pandemic norm—currently running 8.3% below historical baseline—pointing to an increasingly constrained supply outlook. While renters in markets such as Los Angeles, CA (-1.7%), Denver, CO (-3.4%), and Phoenix, AZ (-4.2%), have experienced some relief in asking rents, the slowdown in construction activity raises the risk that this trend could reverse in the years ahead.
While we don’t expect the average seasonally adjusted annual completion rate observed in 2026 to persist throughout an entire year, given the year-over-year declining units under construction, our hypothetical annual completion rates suggest that the rental stock will increase most in the Northeast (+1.1%) by 2027Q1, followed by the South (+0.9%), Midwest (+0.7%), and West (+0.7%). These increases will push the overall rental stock increase by 12.9% in the South, 9.0% in the West, 7.5% in the Northeast, and 3.8% in the Midwest when compared to the pre-pandemic level.
Looking ahead, the pipeline signals further relief for the Northeast and South. The seasonally adjusted annual rate of multifamily starts in the Northeast nearly doubled from 2025Q1 to 2026Q1, jumping from 58,000 to 105,000 (+81%), while the South saw a substantial increase from 164,000 to 230,000 (+40.2%) over the same period. The West, however, tells a less encouraging story: Starts in 2026Q1 dropped to their lowest level of any first quarter since at least 2017, suggesting that the region’s supply pipeline may tighten in the years ahead.
Appendix: Rental Data—50 Largest Metropolitan Areas—April 2026
| Market | Median Asking Rent (0-2 Bedrooms) | YoY Changes |
| Atlanta-Sandy Springs-Roswell, GA | 1,549 | -3.4% |
| Austin-Round Rock-San Marcos, TX | 1,362 | -5.3% |
| Baltimore-Columbia-Towson, MD | 1,806 | -0.7% |
| Birmingham, AL | 1,181 | -1.2% |
| Boston-Cambridge-Newton, MA-NH | 2,921 | -2.9% |
| Buffalo-Cheektowaga, NY | NA | NA |
| Charlotte-Concord-Gastonia, NC-SC | 1,490 | -2.6% |
| Chicago-Naperville-Elgin, IL-IN | 1,797 | -0.3% |
| Cincinnati, OH-KY-IN | 1,324 | 0.8% |
| Cleveland, OH | 1,192 | -0.7% |
| Columbus, OH | 1,174 | -1.2% |
| Dallas-Fort Worth-Arlington, TX | 1,461 | -3.2% |
| Denver-Aurora-Centennial, CO | 1,749 | -3.4% |
| Detroit-Warren-Dearborn, MI | 1,246 | -3.7% |
| Hartford-West Hartford-East Hartford, CT | NA | NA |
| Houston-Pasadena-The Woodlands, TX | 1,382 | -2.5% |
| Indianapolis-Carmel-Greenwood, IN | 1,260 | -1.8% |
| Jacksonville, FL | 1,476 | -2.8% |
| Kansas City, MO-KS | 1,430 | 4.7% |
| Las Vegas-Henderson-North Las Vegas, NV | 1,430 | -2.7% |
| Los Angeles-Long Beach-Anaheim, CA | 2,760 | -1.7% |
| Louisville/Jefferson County, KY-IN | 1,215 | -1.5% |
| Memphis, TN-MS-AR | 1,103 | -4.7% |
| Miami-Fort Lauderdale-West Palm Beach, FL | 2,273 | -2.1% |
| Milwaukee-Waukesha, WI | 1,617 | -0.3% |
| Minneapolis-St. Paul-Bloomington, MN-WI | 1,494 | -0.5% |
| Nashville-Davidson–Murfreesboro–Franklin, TN | 1,474 | -4.8% |
| New Orleans-Metairie, LA | NA | NA |
| New York-Newark-Jersey City, NY-NJ | 2,920 | 1.1% |
| Oklahoma City, OK | 911 | -5.0% |
| Orlando-Kissimmee-Sanford, FL | 1,663 | -2.6% |
| Philadelphia-Camden-Wilmington, PA-NJ-DE-MD | 1,740 | -1.5% |
| Phoenix-Mesa-Chandler, AZ | 1,441 | -4.2% |
| Pittsburgh, PA | 1,463 | 3.0% |
| Portland-Vancouver-Hillsboro, OR-WA | 1,592 | -1.7% |
| Providence-Warwick, RI-MA | NA | NA |
| Raleigh-Cary, NC | 1,433 | -2.1% |
| Richmond, VA | 1,531 | 0.5% |
| Riverside-San Bernardino-Ontario, CA | 2,051 | -3.5% |
| Rochester, NY | NA | NA |
| Sacramento-Roseville-Folsom, CA | 1,823 | -1.5% |
| St. Louis, MO-IL | 1,286 | -0.8% |
| San Antonio-New Braunfels, TX | 1,156 | -4.7% |
| San Diego-Chula Vista-Carlsbad, CA | 2,669 | -3.0% |
| San Francisco-Oakland-Fremont, CA | 2,698 | -2.0% |
| San Jose-Sunnyvale-Santa Clara, CA | 3,306 | 1.3% |
| Seattle-Tacoma-Bellevue, WA | 1,851 | -1.7% |
| Tampa-St. Petersburg-Clearwater, FL | 1,653 | -4.3% |
| Virginia Beach-Chesapeake-Norfolk, VA-NC | 1,564 | 2.4% |
| Washington-Arlington-Alexandria, DC-VA-MD-WV | 2,280 | -1.8% |
Methodology
Rental data as of April 2026 for studio, 1-bedroom, or 2-bedroom units advertised for rent on Realtor.com. Rental units include apartments as well as private rentals (condos, townhomes, single-family homes). We use rental sources that reliably report data each month within the 50 largest metropolitan areas. Realtor.com began publishing regular monthly rental trends reports in October 2020 with data history stretching to March 2019.

