


Highlights
- A buyer of a new home can expect to save $25,335 over the first 10 years of ownership compared to the buyer of a 20-year-old home. These savings are based on energy usage and replacement costs for major systems.
- Savings vary widely from state to state, with New England leading the way in terms of the cost-saving advantage of new construction, due in part to heavy energy usage in this region. Southern states, where new construction is more prevalent and more competitively priced, see less of a cost advantage in ongoing utilities and maintenance savings despite the home price savings upfront.
- In 16 of the top 300 metropolitan areas, the cost savings of buying new construction over 10 years exceed the pricing gap between the median new-construction listing and the median existing-home listing. In 50 of them, new construction was already more affordable at the median.
One of the biggest hindrances to buying a newly built home is the fear that it will break the budget. It’s true that new-construction homes are typically priced higher than resale homes in most markets. According to our most recent quarterly New Construction Insights report, the nationwide gap is about $60,000 between the median-priced new build (just under $450,000) and the median existing home (a bit above $390,000). What’s important to remember is that homeownership is not a one-time expense. Most buyers finance their purchase with a mortgage consisting of monthly principal and interest payments, but even all-cash buyers still have ongoing monthly outlays like utility payments and unscheduled expenses stemming from home repairs. This is where one of the main financial benefits of buying new construction lies: saving money on lower utility bills and less home maintenance. This report will focus on these types of savings, with data provided by our partner Pearl, whose Pearl SCORE® rates every single-family home in the U.S. across five performance pillars: Safety, Comfort, Operations, Resilience, and Energy. We use Pearl SCORE® data to compare the energy and expected repair and maintenance costs of homes built in 2005 against homes built in 2025.
At a national level, based on the costs of heating and cooling the home and replacing major systems, a buyer of an average new home can expect to save $25,335 over the first 10 years of ownership compared to the buyer of a 20-year-old home. Understand your savings, read the latest insights, and find new construction homes for sale in your area.
State-level new-construction savings
The savings achieved on utility bills and major repairs by buying new construction varies across geographies. Colder climates require more energy usage to heat a home through the winter, and so greater savings can be achieved in those places. Roof repairs are more frequent in geographies with greater incidences of high winds and strong storms. Major repairs and equipment replacements cost different amounts in different geographies. Most importantly, though, state and local building codes dictate how new homes are constructed and how effective they are at conserving energy and mitigating against storm damage, and these codes vary widely from state to state and even from municipality to municipality. On top of that, expectations about how energy costs will increase over time vary across geographies. States that have adopted stronger energy codes, which primarily affect how the home is insulated, will have greater differences in the energy efficiency of a new-construction home and an existing home, which will lead to greater savings over time. Similarly, states where energy costs are expected to escalate more in the future will experience greater savings from new-construction homes.
We partnered with Pearl to model out these geographic variations in new-home savings for each state. We used data from actual homes in each state to produce estimates of how much a homeowner could save by purchasing a newly built home compared to a 20-year-old home, holding size fixed at 1,750 square feet to illustrate the effects near the median and focusing on savings over a 10-year span to align with the typical duration of time spent in a home. The savings are computed at a ZIP code level and then aggregated up to a state level. The savings come in two categories from two different models: The first is the difference in utility costs between new-construction and existing homes, and the second is the difference in major replacement costs for HVAC systems, roofs, and water heaters between new-construction and existing homes. The colors of the map below correspond to the total 10-year savings across both categories. You can hover over a state to see the component savings.
Immediately clear is a North-South divide in the country, with greater savings coming from buying new construction outside of the South region. As we know, the South is home to the highest level of new-construction activity and the lowest new-construction price premium compared to existing homes. The less rigorous building codes in the South allow for more new construction to occur and at lower prices, but the trade-off comes in less long-term savings for new-construction buyers, resulting from energy bills and system replacement costs. Energy usage is also in effect here, as these Southern states require less to heat them through the winter, so there is less opportunity for per-unit savings on utility bills to accumulate. Air conditioning and dehumidification are significant expenses in Southern summers, but the costs are not as great as heating homes in Northern winters.
Conversely, the states where new-construction savings are the greatest are all New England states with higher new-construction premiums than the national average, where new construction is more expensive because of the challenges of building there. Building is more difficult in these states for several reasons, one of which is stricter and more modern construction codes. The result, though, is new-construction homes that offer significant savings over existing homes in the rough winter conditions. These top-savings states are shown below.
| State | 10-Year Total New-Construction Savings | New-Construction Premium | IECC Code Adopted |
| Massachusetts | $38,927 | 46.7% | 2021 |
| New Hampshire | $35,885 | 45.5% | 2018 |
| Maine | $34,763 | 48.3% | 2021 |
| Rhode Island | $34,641 | 46.6% | 2024 |
| Vermont | $33,998 | 25.9% | 2021 |
Four of the top 5 states for new-construction savings have adopted IECC building codes from 2021 or later, while just 1 of the bottom 5 states has. Newer editions of the International Energy Conservation Code (IECC) incorporate progressively stricter requirements for insulation, air sealing, windows, and mechanical systems, resulting in homes that consume significantly less energy for heating, cooling, and lighting compared to those built under older codes. The bottom states in terms of savings are all Southern and have generally lower new-construction premiums as well.
| State | 10-Year Total New-Construction Savings | New-Construction Premium | IECC Code Adopted |
| Arkansas | $15,247 | 36.4% | 2018 |
| South Carolina | $16,163 | -3.5% | 2009 |
| Kentucky | $16,392 | 31.4% | 2015 |
| Florida | $16,644 | -2.7% | 2021 |
| Texas | $18,227 | 10.5% | 2015 |
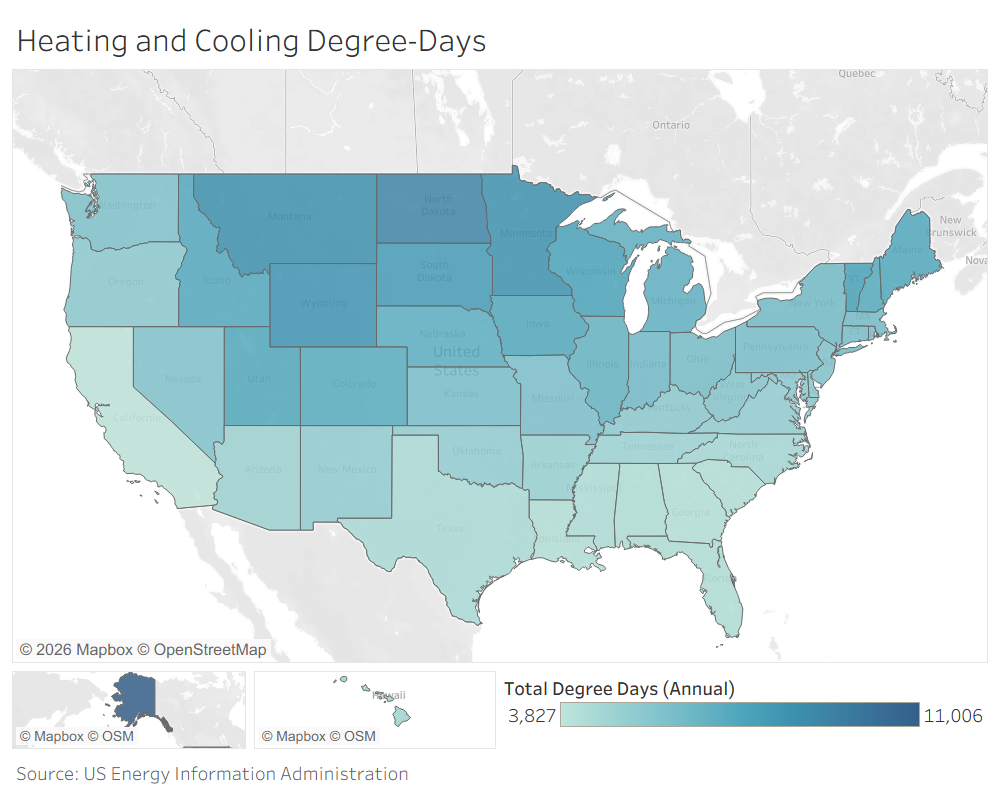
Below is a map that shows the need for heating and cooling energy usage throughout the year in each state, as measured by heating and cooling degree days. This map shows how many degrees Fahrenheit outside of a comfortable living range each day is in each state. In effect, it shows how many degrees for how many days a homeowner must run the heat or air conditioning. The same North-South divide is present here, showing that the volume of usage of the utilities is the primary driver of new-construction savings on a state-by-state basis.
Metros where 10-year savings overcome new-construction price premium
To identify parts of the country where spending more money upfront on a newly built home can pay for itself within 10 years of savings, we look at metro-level single-family home pricing and pull in the total savings from the metro’s primary state. In 50 of the 300 largest metros, new construction is already less expensive than existing homes, which is primarily due to new builds occurring in more far-out reaches of the metro area. We exclude these 50 where buyers are already saving on new construction from Day 1 and instead focus on 16 where new construction is priced above existing homes, but the 10-year savings for new construction in that state cover the difference. They are listed below in descending order of new-construction median listing price.
| Metro | New-Construction Median Listing Price | Existing-Home Median Listing Price | 10-Year Total New- Construction Savings |
| San Diego-Chula Vista-Carlsbad, CA | $1,226,693 | $1,210,500 | $29,243 |
| St. George, UT | $684,447 | $683,984 | $27,670 |
| Salt Lake City-Murray, UT | $652,982 | $637,650 | $27,670 |
| Seaford, DE | $580,619 | $567,742 | $22,075 |
| Salem, OR | $545,333 | $517,467 | $31,404 |
| Madison, WI | $534,284 | $527,358 | $25,983 |
| Kennewick-Richland, WA | $528,807 | $516,383 | $21,187 |
| Billings, MT | $525,477 | $504,142 | $28,520 |
| Merced, CA | $455,719 | $429,644 | $29,243 |
| Jacksonville, FL | $415,901 | $411,583 | $16,644 |
| Bloomington, IN | $402,325 | $390,692 | $28,836 |
| Greenville-Anderson-Greer, SC | $391,793 | $390,098 | $16,163 |
| San Antonio-New Braunfels, TX | $339,642 | $329,083 | $18,227 |
| Hattiesburg, MS | $317,817 | $302,683 | $25,997 |
| Spartanburg, SC | $315,248 | $314,967 | $16,163 |
| Abilene, TX | $310,873 | $298,933 | $18,227 |
These metros are primarily located in the South and West, where stronger new-construction activity keeps the new-construction premium low and within range of being surpassed by 10 years of utilities and maintenance savings. Just two come from the Midwest: notable college towns Madison, WI, and Bloomington, IN. None come from the Northeast, despite the fact that new-construction savings are the greatest there. These metros represent a wide range of price points, showing that the savings from buying new construction can be relevant in any market.
Ways to save even more with new construction
The replacement costs we’ve modeled in this report assume full out-of-pocket payments for owners of both new and existing homes. In reality, many new-construction homes come with warranties from their builders that cover issues that arise in the first few years of living in the home, so the savings for new-construction buyers discussed earlier are actually potentially understated. Commonly, two-year systems warranties are offered that include the HVAC system, so new-construction buyers would pay nothing for those kinds of repairs in the early years of owning their home.
Our recent research has shown that builders are more likely to offer price reductions than existing-home sellers, so there are deals to be found for buyers who can negotiate on the selling price of their new home. A sizable price reduction combined with expected savings over the life of the home could bring a new build into the territory of being more affordable than existing homes over the long run.
Similarly, builders have been aggressively offering buyer incentives recently. These include cash offerings that basically equate to price reductions, but also mortgage rate buydowns. These promotional mortgage rates are especially attractive in the current high-rate environment and can equate to serious savings. In past research, we’ve shown that the average new-construction buyer pays about a full percentage point less on their 30-year mortgage than an existing-home buyer. On a $450,000 home purchase with 10% down, the difference between a 6.3% rate and a 5.3% rate is over $250 per month. This is serious, budget-expanding savings for shopping for new construction, and on a 10-year horizon, it represents an additional $30,000 in savings from buying new construction.
Methodology
Listing price data comes from listings on Realtor.com in the first quarter of 2026. Utility savings data comes from Pearl SCORE® models. Energy costs are generated by multiplying modeled energy consumption for an average 1,750-square-foot home built to prevailing code by average state retail gas and electric prices. An escalation factor sourced from EIA is applied to the state-level costs to generate cumulative savings over time. Replacement and maintenance cost data also come from Pearl SCORE® models, with three components: life span and degradation, replacement cost, and maintenance cost. Each component is estimated at the ZIP code level and aggregated to the state level. National estimates are a weighted average of state estimates based on the number of single-family homes in each ZIP code. Degree-day estimates are sourced from EIA and totaled by adding heating degree days to cooling degree days.

