



Key takeaways:
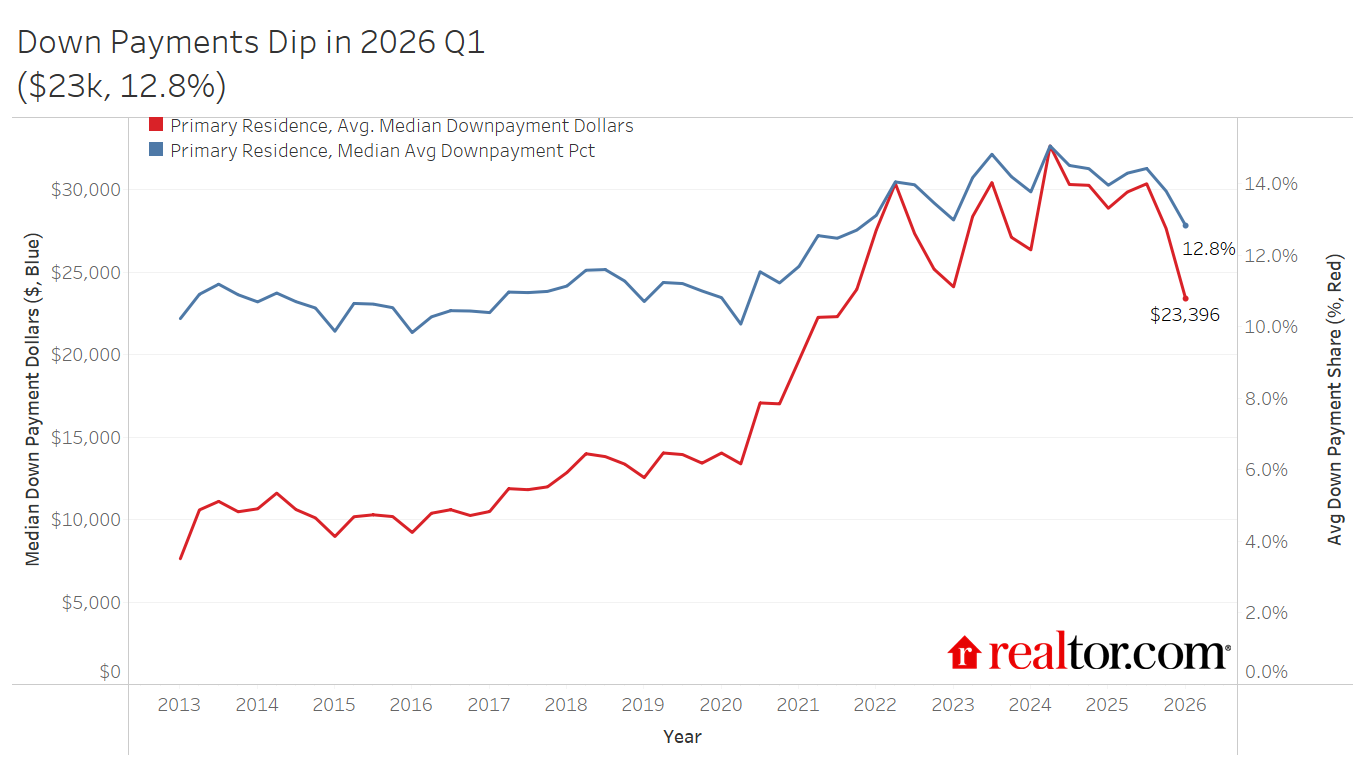
- Down payments hit a 4-year low. The median fell to $23,400 and 12.8% in Q1 2026, down 19% and 1.2 ppts year-over-year, though they remain above pre-pandemic norms.
- The post-pandemic down payment surge is unwinding. Down payment amounts and shares have declined for four consecutive quarters, mirroring price moderation and rising inventory.
- Government-backed loans are filling the affordability gap. FHA and VA loans now account for more than a third of all purchase mortgages, with VA share at its highest level in over a decade.
- The buyer pool is broadening, but stretched. Falling FICO scores signal more buyers re-entering the market, but their reliance on low-down-payment government programs points to buyers stretching to participate rather than buying from a position of strength.
- The regional breakdown in sales influencing the national softening. While down payments remain well above pre-pandemic levels everywhere, more buying is happening in the lower-down-payment South and Midwest, even as the Northeast stays deeply competitive.
Down Payments Fall as Market Softens and Buyers Stretch
The typical down payment share fell for four consecutive quarters, softening to 12.8% in Q1 of 2026, 1.1 percentage points below a year prior. In dollar terms, down payments fell to their lowest level since 2021 Q3, down a sizable 19.0% year-over-year.
In the first quarter of 2026, the median down payment was $23,400, more than $4,000 below 2025 Q4 and more than $5,000 below one year prior. Though down payments tend to reach their seasonal low in Q1, this significant drop both monthly and annually may indicate a shift in the previous upward trend in down payments.
Historically, down payments have risen sharply from spring through late summer, before easing as the market slows into winter. In 2025, however, the increase was more modest, and the drop into the winter was more severe. Down payments peaked for 2025 at 14.4% and $30,400 in Q3 before falling through Q4 and into the beginning of 2026. The latest monthly data shows a pick up in down payments in March and April 2026, as is seasonally typical, though the level remains well-below a year ago. In April 2026, the typical U.S. down payment was $25,000 and represented an average 13.2% of the purchase price, below the April 2025 levels of $27,500 and 13.8%.
The easing down payment trend mirrors broader conditions in the housing market. The Realtor.com April 2026 Monthly Housing Report found that active listings rose year-over-year for the 28th consecutive month, while home price growth continued to cool, a combination that is giving buyers more negotiating room and reducing the pressure to lead with an outsized down payment. The median list price slipped year-over-year in April, while the national median existing home sale price rose only modestly in Q1 2026 according to data from the National Association of Realtors, a stark contrast to the rapid appreciation that drove down payments sharply higher in 2021 and 2022. Mortgage rates, while still elevated, have also eased from a year ago, with the Realtor.com 2026 forecast projecting that the typical monthly payment share of income will dip below 30% for the first time since 2022 — a marginal but meaningful shift for buyers who had been on the sidelines.
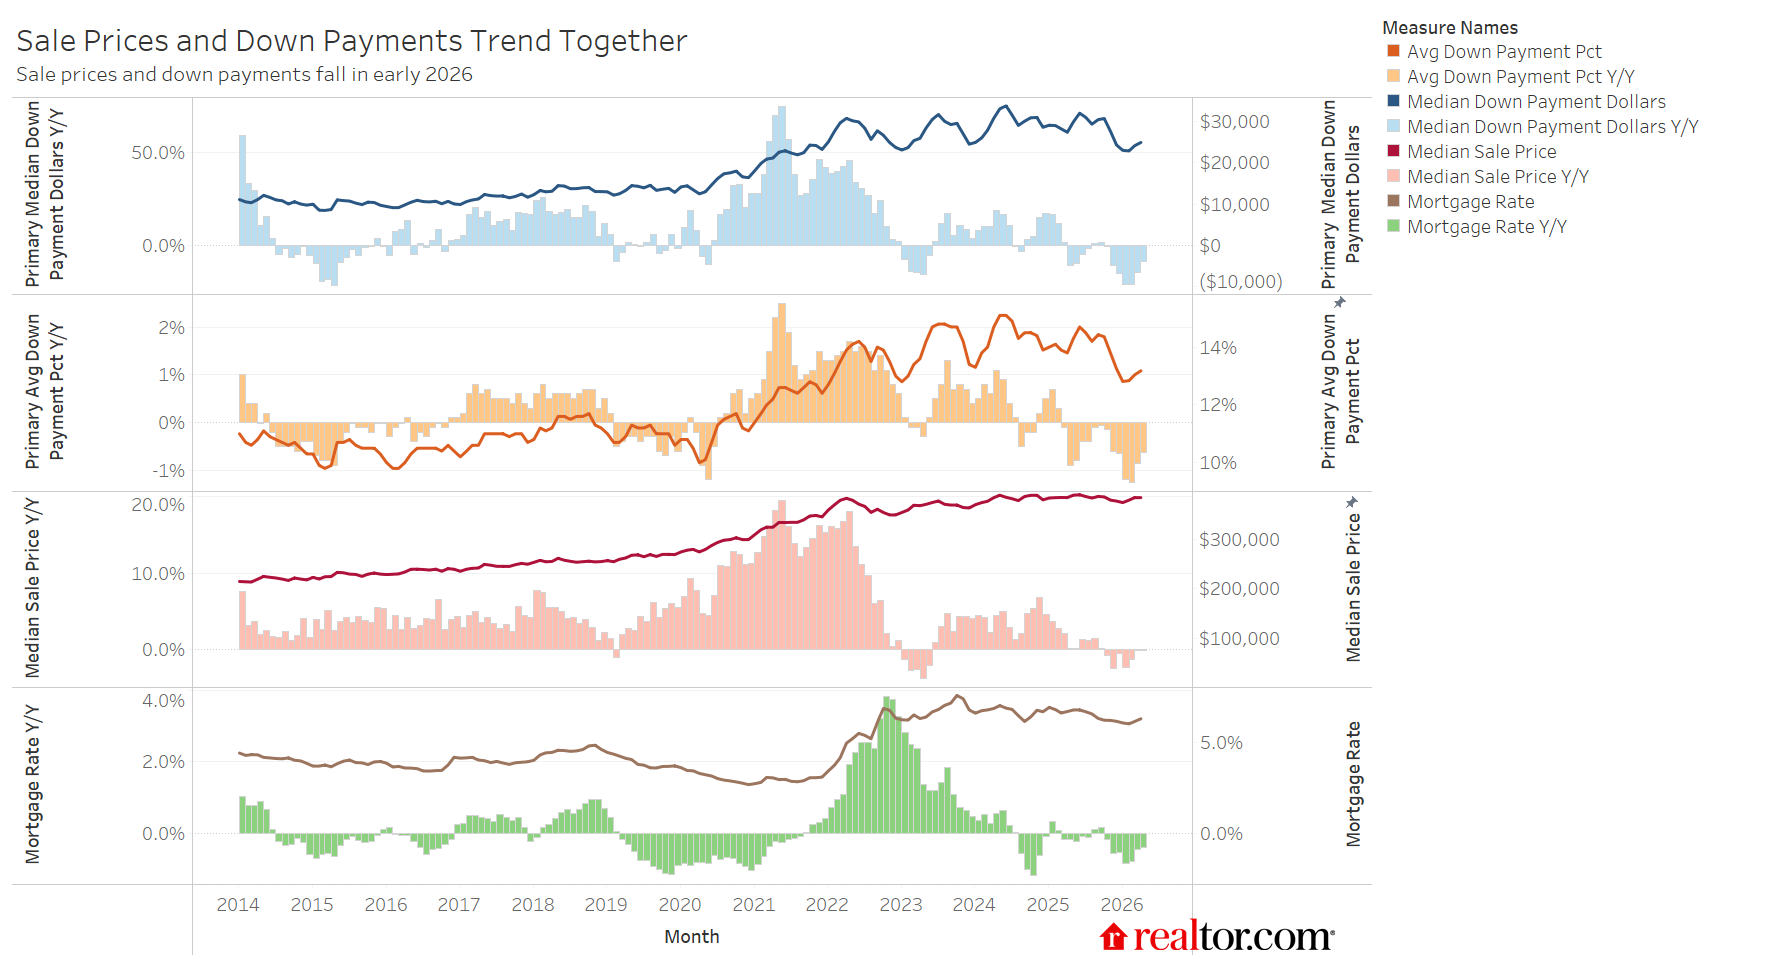
Together, these forces are drawing a somewhat different buyer into the market. As affordability improves at the edges and competition relaxes, first-time and lower-income buyers who were priced out may be starting to re-engage. The result is a market that is slowly broadening. The Realtor.com spring 2026 seller survey found that nearly 40% of potential sellers now expect to make concessions, up sharply from 30% in 2025, a signal that even sellers recognize buyers have reclaimed some footing. Whether the pickup in down payments seen in March and April marks the beginning of a renewed upward trend, or simply a seasonal bounce in a structurally softer market, will depend heavily on how inventory, rates, and consumer confidence evolve through the second half of the year.
Down Payments Remain Above Pre-Pandemic Norms, Fall from Post-Pandemic Highs
While the recent drop is notable, it is worth situating these figures within the longer arc of the post-pandemic housing market; put simply, down payments remain above pre-pandemic norms. In Q1 of 2019, the typical down payment was $12,500 and 10.7%, well below today’s norms on both accounts. Over the past 7 years, the typical down payment dollar amount has risen 87.2% while the typical home sale price has climbed just 47.6%, emphasizing how buyers are utilizing higher down payments to compete and to minimize the impact of elevated mortgage rates. As a share of purchase price, down payments have climbed 2.1 percentage points compared to 7 years ago. Home equity remains near record-highs, suggesting that repeat buyers are in a good position to utilize existing home equity to put down a sizable down payment in their next purchase.
Notably, down payments hit their first-quarter peak in 2025 at 14.0% and $28,900. This year’s spring and summer market will be important signals of whether this softening down payment trend is an indication of sustained softening in the housing market, or just a particularly deep winter lull.
| Primary Residence | Avg Down Payment as % of Purchase Price | Med. Down Payment ($ amt) | ||||||
| 2019 Q1 | 2021 Q1 | 2025 Q1 | 2026 Q1 | 2019 Q1 | 2021 Q1 | 2025 Q1 | 2026 Q1 | |
| United States | 10.7% | 11.7% | 14.0% | 12.8% | $12,500 | $19,700 | $28,900 | $23,400 |
Buyer Credit-Worthiness Softens, Government Loan Utilization Rises
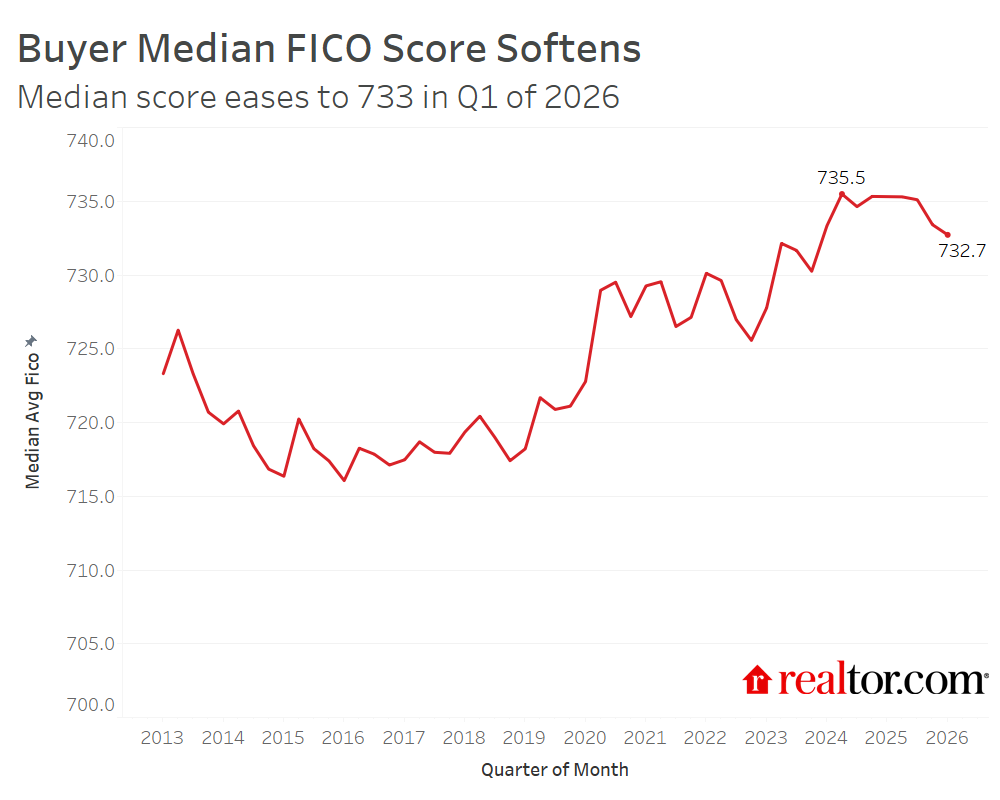
The median FICO score of homebuyers steadily climbed over the past several years before leveling off through most of 2025 and falling into late 2025 and early 2026. The typical buyer’s FICO score remains above pre-pandemic norms at 733, but the directional shift is meaningful: as mortgage rates dip below year-ago levels and home prices soften in many markets, the affordability picture is improving at the margins, drawing more on-the-fence buyers back in, including those with less pristine credit profiles who had previously been priced or screened out. This mirrors a broader national trend: both the median and average U.S. FICO score declined between spring and fall 2025. As with the downpayment size trends, it’s worth reiterating that credit-worthiness, as measured by FICO scores, remains above pre-pandemic norms even as it softens.
Rather than returning through conventional channels, however, many of these re-entering buyers are leaning on government-backed loan programs to make deals work. FHA’s share of purchase mortgages has held above 24% for five consecutive quarters, its most sustained elevated stretch since 2016, while VA loans surged to 11.7% in early 2026, their highest share in over a decade. Together, these programs now account for more than a third of all purchase mortgages, as buyers increasingly turn to lower down payment requirements and more flexible underwriting standards to bridge the affordability gap.

This shift carries important implications for housing demand and inequality. Government-backed programs are serving as a critical pressure valve, keeping the door to homeownership open for buyers who might otherwise be shut out entirely. But the growing reliance on FHA and VA financing also reflects how much the conventional path to homeownership has narrowed as the share of conforming loans has fallen to its lowest level since 2019, a sign that standard financing remains out of reach for buyers without significant cash reserves. The loosening at the edges including falling FICOs, rising government-backed share, and shrinking down payments, points to more buyers stretching further just to participate, underscoring a deepening divide in who can access homeownership, and on what terms.
While government-backed mortgage programs can make homeownership more accessible to more households, we have also seen rising mortgage delinquency in recent quarters, especially in the FHA segment, suggesting that for some buyers, the stretch to get in may be outpacing their ability to stay in. When buyers enter the market with thinner down payments and lower credit scores, they carry less of a financial cushion to weather job loss, unexpected expenses, or even modest payment increases as can happen if property taxes, homeowners association dues, or insurance costs increase.
Renter Down Payment Readiness
The typical down payment on a home purchase ran $23,400 in the first quarter of 2026. With affordability still stretched for many households, it is worth unpacking why housing demand remains as subdued as it is. One way to do that is to examine whether today’s renters have the financial resources to clear that bar in the first place.
The typical renter has very little wealth to tap. As the table below shows, the median renter holds an estimated $2,600 in liquid assets (checking and savings accounts). Adding stocks, bonds, and mutual funds held outside of retirement accounts moves the needle only modestly, to $2,800. Even when renters are permitted to draw on IRA balances up to the IRS first-time homebuyer exemption limit, the median available for a downpayment barely budges, to around $2,900.
This pattern holds across age groups, too. The median renter under 45, who is in the strongest financial position of any cohort, has an estimated $4,200 in accessible assets under the most permissive definition. For the typical renter, regardless of age, their financial position overall is the big constraint, not choosing which asset on their household balance sheet to liquidate.
| Median Downpayment Potential Among Renters | |||
| By Asset Potential and Age Group · 2025 Q4 Dollars | |||
| Age Group | Liquid Assets Only | + Stocks & Bonds | + IRA |
| All Renters | $2,605 | $2,787 | $2,891 |
| Under 45 | $3,166 | $3,925 | $4,213 |
| 45–64 | $1,570 | $1,701 | $1,818 |
| 65+ | $2,224 | $2,551 | $2,617 |
| Note: SCF 2022 asset values aged to 2025 Q4 using Federal Reserve Z.1 B.101h aggregate growth factors. IRA contribution capped at $10,000 (single) / $20,000 (married/partnered) per IRS first-time homebuyer exemption. | |||
That said, medians obscure a long, meaningful tail. Looking beyond the typical renter, asking what share of today’s renters could plausibly meet a down payment threshold reveals a more nuanced picture. Roughly 15 to 20 percent of renters have sufficient assets to cover the $23,400 conventional median down payment (left panel). That statistic rises to about 20 to 26 percent when the threshold is lowered to a 3.5 percent FHA down payment on the April 2026 median list price of $425,000, or $14,875 (right set of panels). Current estimates put the number of US renter households conservatively around 45 million, so that implies that there are around 6.75 to 9 million renter households that could cover a $23,400 down payment and 9 to 11.7 million that could cover an 3.5% down payment on the median list priced home.
By age, younger renters under 45 are actually the best-positioned cohort, with about 21 percent able to meet the conventional threshold under the most permissive asset definition. This is somewhat counterintuitive with the typical financial lifecycle, but consistent with the idea that older renters are more negatively selected: those who remain renters into their 40s, 50s, and beyond tend to skew toward lower incomes and lower wealth accumulation relative to their age peers who have already transitioned to ownership.
| Share of Renters Who Could Meet Each Downpayment Threshold | |||||||
| By Asset Definition and Age Group · Weighted Estimates | |||||||
| 2026 Q1 Median: $23,400 | FHA, 3.5% Down | ||||||
| Age Group | Liquid Assets Only | + Stocks & Bonds | + IRA | Liquid Assets Only | + Stocks & Bonds | + IRA | |
| All Renters | 15.3% | 18.3% | 19.9% | 20.9% | 24.1% | 26.0% | |
| Under 45 | 17.5% | 20.1% | 21.3% | 24.1% | 27.2% | 28.9% | |
| 45–64 | 10.9% | 13.3% | 15.9% | 16.7% | 18.8% | 21.0% | |
| 65+ | 15.1% | 19.7% | 21.1% | 17.3% | 22.3% | 24.6% | |
| Note: SCF 2022 asset values aged to 2025 Q4 using Federal Reserve Z.1 B.101h aggregate growth factors. IRA contribution capped at $10,000 (single) / $20,000 (married/partnered) per IRS first-time homebuyer exemption. Thresholds: 2026 Q1 Median = $23,400; FHA 3.5% Down = 3.5% × $425,000 April 2026 median asking price ($14,875). | |||||||
Regional Down Payment Trends
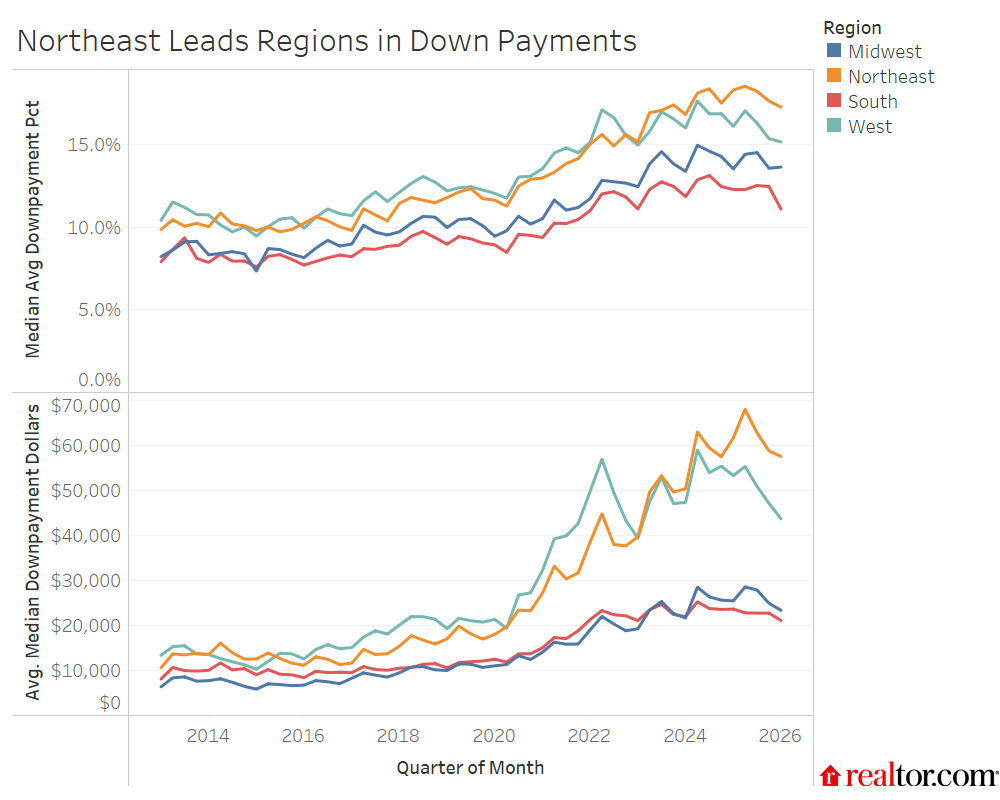
In the first quarter of 2026, down payments were highest in the Northeast, where buyers typically put down 17.3% of the purchase price, followed by the West (15.2%), Midwest (13.6%), and South (11.1%). Three of the four regions saw declines in typical down payment shares compared with a year earlier. The South recorded the largest drop, down 1.2 percentage points year-over-year, followed by the Northeast (-1.0 ppts), and the West (-0.9 ppt). The Midwest posted a 0.1 percentage point increase in down payment share year-over-year.
These regional patterns align with where markets sit on the Realtor.com Market Clock. The South and West, where inventory has recovered more fully, are exhibiting softer conditions that give buyers more negotiating room, reflected in softening down payments. The Northeast and Midwest, by contrast, remain more competitive, where buyers are more likely to put more money down to win deals.
| Avg Downpayment Pct | |||||
| Region | 2019 Q1 | 2025 Q1 | 2026 Q1 | YY | Vs 2019 |
| Midwest | 10.0% | 13.5% | 13.6% | 0.1 ppts | +3.6 ppts |
| Northeast | 11.8% | 18.3% | 17.3% | -1.0 ppts | +5.5 ppts |
| South | 9.0% | 12.3% | 11.1% | -1.2 ppts | +2.1 ppts |
| West | 12.2% | 16.1% | 15.2% | -0.9 ppts | +3.0 ppts |
In dollar terms, regional down payment trends were solidly softer year-over-year. The West saw the largest annual drop of 18.2%, followed by the South (-11.0%), the Midwest (-8.2%) and the Northeast (-6.8%).
The Northeast posted the highest median down payment at $57,600, reflecting higher home prices and more competition. The Northeast also sees the largest gap between what buyers are paying as a down payment today compared to pre-pandemic.
| Median Downpayment Dollars | |||||
| Region | 2019 Q1 | 2025 Q1 | 2026 Q1 | YY | Vs 2019 |
| Midwest | $10,000 | $25,500 | $23,400 | -8.2% | 134.0% |
| Northeast | $17,100 | $61,800 | $57,600 | -6.8% | 236.8% |
| South | $10,600 | $23,700 | $21,100 | -11.0% | 99.1% |
| West | $19,300 | $53,400 | $43,700 | -18.2% | 126.4% |
Compared to 2019, the Northeast has seen down payments climb 236.8%, significantly more than the next closest gap of 134.0% in the Midwest. These trends are consistent with the persistent upward pressure on home prices in these regions as scarce inventory is met with sustained buyer demand. Although data show that the West and South have recovered relative to pre-pandemic for-sale home inventory, the Northeast and Midwest continue to lag behind by a shocking amount, nearly 40 to 50%, mirroring the regional variation in underbuilding relative to demand. The West and South have also seen down payments grow significantly compared to pre-pandemic, but recent trends show more significant softening in these regions as ample inventory and softening prices brings more buyers into the market.
Importantly, the composition of where sales are happening is amplifying the national softening trend. The South, the most affordable and most supply-recovered major region, accounted for 44.5% of all home sales in 2025, up from 43.0% in 2019. The Midwest’s share also grew, from 25.7% to 26.7%, while the West and Northeast both lost share. Because lower down payment markets are now driving a larger slice of national transaction volume, the national average is being pulled down even as the Northeast remains deeply competitive. The headline softening in down payments is, in part, a story about where buying is actually happening, and increasingly, that’s in the well-supplied South and the affordable Midwest.
What to Watch: The Spring and Summer Market Will Be Telling
The trajectory of down payments through mid-2026 will serve as an important barometer for the broader health of the housing market. A few dynamics are worth watching closely.
Will the spring bounce sustain? Down payments ticked up in March and April, as they typically do seasonally. The question is whether this year’s spring rebound reaches levels consistent with prior years, or whether it stalls below year-ago comparisons, as it has so far. If the April 2026 down payment of $25,000 and 13.2% fails to climb toward the 14–15% range by summer, it would suggest the structural softening underway is real and not simply seasonal noise. The Realtor.com Market Clock which shows national balance and balanced or buyer-friendly conditions in many markets suggests that a structural softening is likely, and we’ll watch the incoming data to confirm.
The government loan share is worth watching closely. FHA and VA utilization at current levels is consistent with a market that is gradually broadening access, but could also mean more buyers are stretching to afford a home. A stabilization or recovery in conforming loan share would suggest that more buyers are re-entering through conventional channels, possibly with stronger financial footing.
Regional dynamics could shift the national story. Some degree of the current softening is driven by more transactions occurring in the low-down-payment South and Midwest, which together accounted for more than 71% of all sales in 2025. If inventory tightens in those markets, or if price softening slows new seller entry, the national average could firm up quickly. Meanwhile, any meaningful inventory unlock in the Northeast, where down payments remain dramatically above pre-pandemic levels and other regions, could reshape the competitive landscape and bring down payment norms there more in line with the rest of the country.
The macroeconomic backdrop remains fragile. If economic uncertainty deepens, the buyers most likely to exit the market first are the marginal ones who have only recently re-entered through FHA and VA programs, which could stabilize or reverse the government-backed share trend while also reducing overall transaction volume. The down payment data, read alongside loan type composition and FICO trends, will continue to be a sensitive early indicator of which direction the market is heading.
Methodology:
Down payment trends analyzed at the national- and state-level through April 2026 using Optimal Blue data. Down payment as a share of sale price is calculated as an average across the data. Down payment as a dollar amount is calculated by taking the median across the data. All comparisons are between the first quarter of the current and previous years unless otherwise stated.