


Santa Fe claims the Crown as Smaller Lifestyle Markets Transform the Luxury Landscape
This quarter’s luxury housing market leaderboard marks a significant reshuffle in the ranking. Six new metros entered the top 10, and the previous top two, Detroit and St. Louis, both fell out entirely. The message from this quarter’s data is clear: today’s top luxury markets are places where high-end buyers get more than a home, they get a lifestyle.
Each quarter, Realtor.com and the Wall Street Journal team up to identify the highest-performing and most attractive metro areas for luxury home purchases. We score 60 different luxury housing markets across the country in categories that include supply and demand strength, economic health, and quality of life. This spring’s ranking highlights that luxury buyers are increasingly choosing places that deliver on daily livability, not just real estate fundamentals.
Highlights
- Santa Fe, NM, leaps 18 spots to claim the No. 1 position, powered by strong amenities, low taxes, and minimal climate risk.
- Pittsfield, MA, makes its debut in the top 2, the smallest metro in the ranking by population but one of the strongest on quality-of-life metrics.
- Six new metros entered the top 10 this quarter, with Boulder, San Jose, Barnstable Town, and Hilton Head Island also breaking through.
- Detroit and St. Louis, the previous No. 1 and No. 2, dropped out of the top 10, as the ranking increasingly rewards livability depth alongside market fundamentals.
Results for This Quarter
| Spring 2026 Luxury Ranking | Metro Area | 90th Percentile Listing Price | Population | Unemployment Rate |
| 1 | Santa Fe, NM | $2,698,000 | 156,907 | 3.8% |
| 2 | Pittsfield, MA | $1,764,000 | 128,224 | 4.8% |
| 3 | Charlottesville, VA | $1,485,750 | 228,597 | 3.1% |
| 4 | Boulder, CO | $3,096,600 | 328,560 | 3.8% |
| 5 | San Jose-Sunnyvale-Santa Clara, CA | $3,499,000 | 1,984,473 | 4.5% |
| 6 | Salt Lake City, UT | $1,221,788 | 1,308,377 | 3.7% |
| 7 | San Diego-Carlsbad, CA | $2,872,469 | 3,282,248 | 4.8% |
| 8 | Santa Maria-Santa Barbara, CA | $9,737,500 | 442,065 | 4.9% |
| 9 | Barnstable Town, MA | $3,717,400 | 233,539 | 5.3% |
| 10 | Hilton Head Island-Bluffton-Beaufort, SC | $1,924,750 | 242,966 | 4.5% |

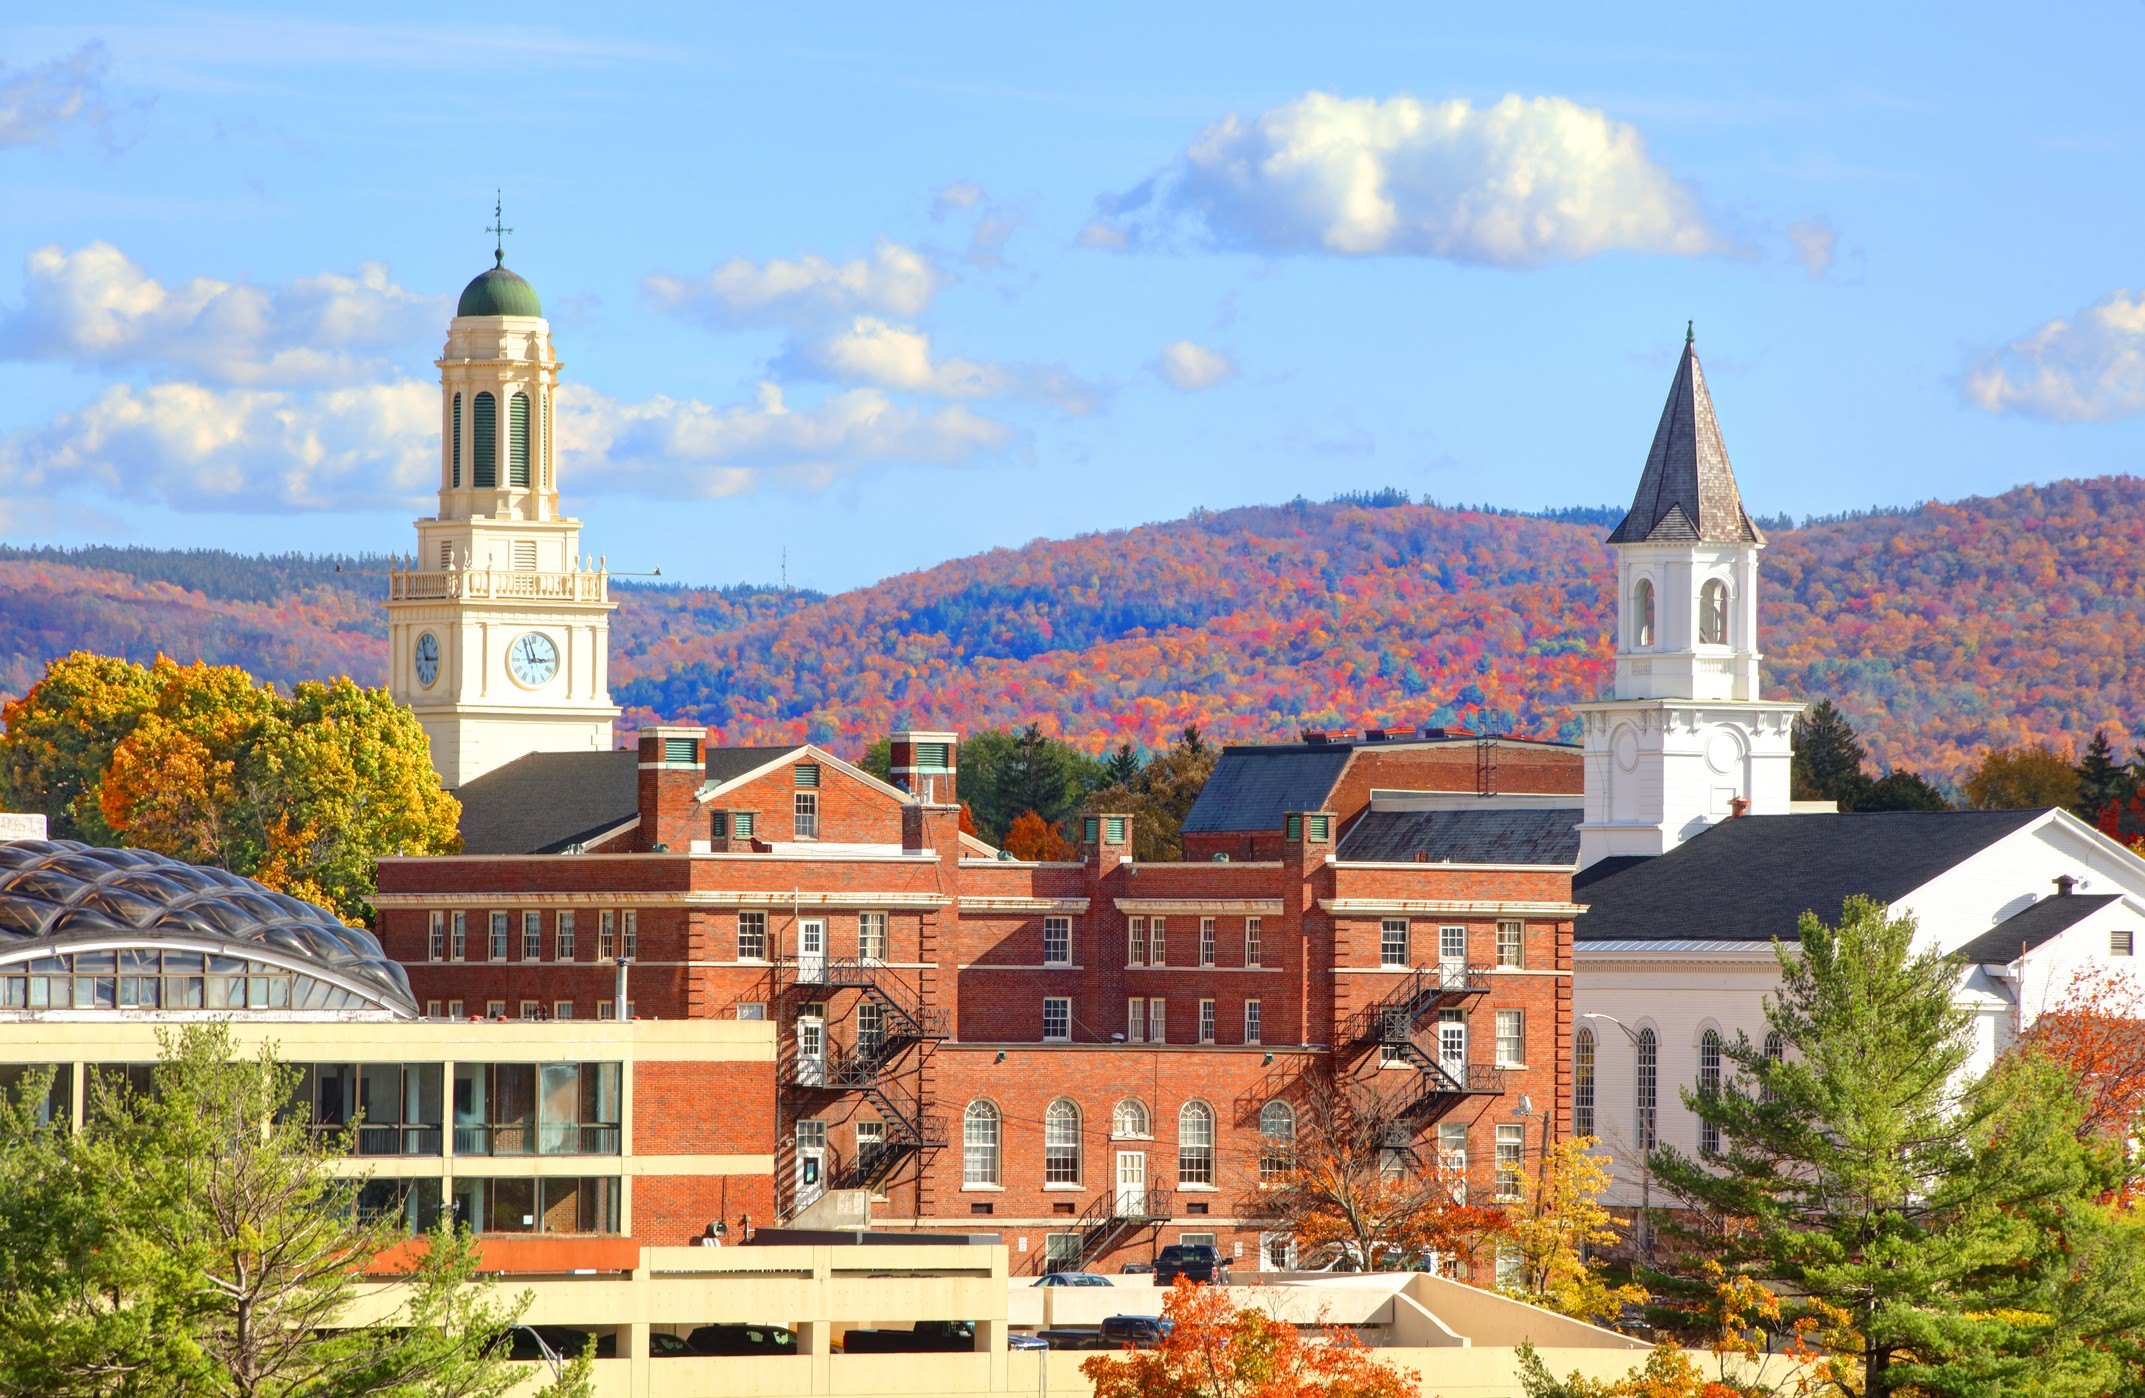
Spotlight: Santa Fe to the Top
Santa Fe’s ascent to No. 1 caps one of the more dramatic arcs in the ranking’s recent history. The metro held the No. 2 spot in July 2025, slipped to No. 4 by October, and was out of the top 10 during the winter ranking.
What makes Santa Fe’s case compelling is the breadth of its strengths. This is not a market that wins in a single category. Instead, it posts consistently strong scores across the metrics that matter to many luxury buyers. The average commute in the Santa Fe metro clocks in at roughly 25 minutes, well below many of its peers. Property tax rates sit at approximately 0.45%, among the lowest in the ranking. Climate is another strong point, with the risk exposure being minimal, a factor that has become increasingly relevant as buyers weigh long-term value.

Buyenlarge/Getty Images
Santa Fe also carries a significant second-home appeal. Vacation homes account for roughly three times the national average in the metro, underscoring its draw as a destination for buyers seeking a high-end retreat that doubles as a long-term asset. For those buyers, Santa Fe offers a rare combination: cultural richness, natural beauty, and a cost structure that rewards rather than penalizes the luxury buyer.
Luxury prices in Santa Fe have grown 11.3% year over year at the 90th percentile, while the national 90th percentile is down 2.9%. That upward price momentum, paired with improving supply and demand conditions, reinforces that this is a market with real traction, not just favorable conditions on paper.
Spotlight: Pittsfield Emerges as the Berkshires Surprise
One of the most unexpected names on this quarter’s leaderboard, Pittsfield, MA, climbed from No. 13 to the No. 2 spot. With a population of roughly 128,000, it is the smallest metro in the entire ranking by a wide margin, and yet it outscored all but one market this quarter.
Pittsfield may not first come to mind when you think of a luxury location, however, the Pittsfield metropolitan area, per OMB designations, includes the well-renowned Berkshire County. Pittsfield’s Berkshires location makes it a natural complement to the broader New York City and Boston luxury orbits, much like how Bridgeport-Stamford benefits from its proximity to Manhattan. Buyers seeking a high-end lifestyle with access to cultural institutions, outdoor recreation, and a manageable pace of daily life will find Pittsfield increasingly on their radar.
Getty Images
Pittsfield’s rise is driven by an exceptional quality-of-life profile. The metro posted the highest amenities score of any market in the ranking, reflecting a concentration of everyday conveniences, from coffee shops and specialty grocers to fitness studios, that far exceeds what its population size might suggest. Average commute times are the shortest in the ranking at just over 20 minutes, and the metro’s cost of living remains favorable relative to the broader Northeast.
The luxury tier in Pittsfield is also showing signs of recalibration, with the 90th-percentile listing price at $1,764,000, down 7.9% year-over-year. The price shift has improved the value proposition for buyers entering the luxury space. Supply and demand fundamentals remain healthy, with supply conditions improving quarter over quarter.
The Bigger Picture: Lifestyle Markets Take the Lead
This quarter’s ranking represents a meaningful shift in what defines a top luxury market. Four of the top five metros have populations under 350,000. The common thread among the top performers is not price or inventory volume, it is the ability to deliver a high quality of daily life alongside real estate fundamentals.
Charlottesville, VA (No. 3), held its ground as a consistent performer, combining strong supply and demand with low unemployment (3.1%) and minimal climate risk. Boulder, CO (No. 4), made a major move from No. 22, propelled by its strong amenities profile and small business density (the highest in the ranking). San Jose-Sunnyvale-Santa Clara, CA (No. 5), brought an entirely different profile, posting the highest supply score of any market in the ranking and benefiting from its role as a global technology hub.
Salt Lake City (No. 6) and San Diego (No. 7) both remained in the top 10, continuing to deliver on the fundamentals that have kept them competitive across multiple quarters. Santa Maria-Santa Barbara (No. 8) held steady as a reminder that ultra-premium markets, where the 90th percentile listing price exceeds $9.7 million, can remain competitive when lifestyle appeal and buyer demand are strong enough.
The two other new entries rounding out the top 10, Barnstable Town, MA (No. 9) and Hilton Head Island, SC (No. 10), both share a coastal vacation-home appeal. Barnstable Town posted one of the largest jumps of any market, climbing 26 spots from No. 35. Hilton Head Island, which previously appeared in the top 10 during October 2025 before dropping out, returned on the strength of improving demand and solid amenities.
What Happened to Detroit and St. Louis?
The previous No. 1 and No. 2 markets have not suddenly become undesirable. Detroit (No. 13) and St. Louis (No. 12) continue to post some of the strongest supply and demand scores in the entire ranking. Detroit’s supply score (98.4) and demand score (88.3) remain near the top of the field, and St. Louis posted the second-highest demand score overall (93.3).
Where both metros lost ground this quarter is in the quality-of-life and livability dimensions that have become increasingly important to the ranking. Factors such as amenities density, commute times, and regional cost-of-living comparisons carry more influence in a market environment where luxury buyers have become highly selective. Detroit and St. Louis remain strong markets for buyers who prioritize value and market liquidity, but this quarter’s results underscore that today’s luxury leaderboard rewards all-around livability.
Honorable Mentions
Just outside the top 10, Atlanta (No. 11) narrowly missed the cut and continues to demonstrate strong luxury fundamentals across a large metro. Sacramento (No. 15) posted one of the biggest jumps in the broader ranking, climbing 28 spots from No. 43, as California’s capital benefits from improving supply conditions and a more favorable price trajectory.
Portland, ME, one of the more notable slides this quarter (from No. 7 to No. 36), may have lost ground on specific scoring dimensions but remains a market with enduring lifestyle appeal for luxury buyers drawn to New England’s coast.
Methodology
The ranking evaluates the 30 most populous core-based statistical areas, as measured by the U.S. Census Bureau and defined by March 2020 delineation standards, plus the 30 markets with the highest concentration of homes listed for more than one million dollars for eight indicators across two broad categories: real estate market (60%) and economic health and quality of life (40%). Each market is ranked on a scale of 0 to 100 according to the category indicators, and the overall index is based on the weighted sum of these rankings. The real estate market category indicators are: real estate demand (15%), based on average pageviews per property; real estate supply (15%), based on median days on market for real estate listings, median listing price trend (10%), based on annual price growth over the quarter, property taxes (10%) and climate risk to properties (10%). The economic and quality of life category indicators are: unemployment (5%); wages (5%); regional price parities (5%); the share of foreign born (5%); small businesses (5%); amenities (10%), measured as the average number of stores per specific “everyday splurge” category (coffee, upscale/specialty grocery, home improvement, fitness) per capita in an area; and commute time (5%).

