


Introduction
The housing market entered 2026 with a spring in its step, with falling mortgage rates, rising inventory, and softening home asking prices. The outlook shifted in late February as the conflict in Iran raised concerns over inflation and broader geopolitical uncertainty.
Through January and into mid-February, conditions were quietly improving on nearly every front. Mortgage rates briefly dipped below 6% for the first time since 2022, crossing a psychological threshold that tends to unlock buyer confidence. Active inventory was up more than 8% year over year nationally in the first quarter, giving shoppers more options. The lock-in effect, namely a significant share of homeowners sitting on sub-4% mortgages and refusing to sell into a 6%-plus world, was showing early signs of easing as life events pushed more listings onto the market.
Then, the conflict in Iran shifted the market from steadily improving to rather volatile. Oil prices surged toward $100 a barrel, rattling bond markets and reigniting inflation concerns. Mortgage rates rose for four consecutive weeks, including the largest one-week jump since April 2025, when “Liberation Day” tariffs had caused a similar spike in Treasury yields. By late March the 30-year fixed had climbed to 6.46%, its highest level in nearly seven months, erasing the brief window below 6% almost as quickly as it had opened.
The picture isn’t uniformly bleak. Affordability is meaningfully better than a year ago, with lower home prices and mortgage rates persisting, even accounting for the recent rate surge. The regional divide, however, has only sharpened. Much of the West and South is now above pre-pandemic inventory levels, offering buyers real options and forcing sellers to compete as buyer-favoring market conditions prevail in many markets. Meanwhile, much of the Midwest and Northeast remains historically tight, with prices continuing to rise, supported by constrained inventory and strong labor markets.
Buyers navigating rising rates and economic uncertainty are making increasingly deliberate decisions about where their dollar goes furthest, not just in price, but in stability, livability, and long-term value. The Spring 2026 WSJ/Realtor.com Housing Market Ranking highlights the markets best positioned to deliver on all three.
Spring 2026 WSJ/Realtor.com Housing Market Ranking
As the market makes its way through what may or may not prove to be a busy spring, buyers are navigating volatile mortgage rates and broader economic uncertainty. In this environment, metros that combine relative affordability with steady demand, improving supply conditions, and strong quality-of-life fundamentals are emerging as standouts.
The spring 2026 ranking evaluates the 200 most populous U.S. metropolitan areas using a combination of housing market conditions and broader measures of economic health and livability. Together, these factors highlight markets where buyers are more likely to find balance in an otherwise challenging housing environment.
| Rank | Metro | Pop. | Unemployment Rate (%) | Median Home Listing Price, March 2026 |
| 1 | South Bend-Mishawaka, Ind.-Mich | 324,538 | 4.3% | $317,450 |
| 2 | Appleton, Wis. | 249,876 | 3.9% | $389,900 |
| 3 | Canton-Massillon, Ohio | 400,246 | 4.4% | $239,900 |
| 4 | Lancaster, Pa. | 563,159 | 4.6% | $420,725 |
| 5 | Springfield, Mass. | 464,338 | 5.5% | $352,475 |
| 6 | Akron, Ohio | 701,780 | 4.9% | $229,500 |
| 7 | Manchester-Nashua, N.H. | 433,415 | 3.5% | $549,000 |
| 8 | Lynchburg, Va. | 269,169 | 4.6% | $364,950 |
| 9 | Hagerstown-Martinsburg, Md.-W. Va. | 315,280 | 4.5% | $353,945 |
| 10 | Flint, Mich | 401,093 | 4.8% | $198,450 |
| 11 | Fort Wayne, Ind. | 466,258 | 5.2% | $311,950 |
| 12 | Reading, Pa. | 440,072 | 5.3% | $322,450 |
| 13 | Lansing-East Lansing, Mich | 479,722 | 5.0% | $222,450 |
| 14 | Milwaukee-Waukesha-West Allis, Wis. | 1,575,010 | 6.9% | $387,858 |
| 15 | Springfield, Mo. | 500,694 | 4.0% | $339,450 |
| 16 | Norwich-New London, Conn. | 284,015 | 3.6% | $432,075 |
| 17 | Peoria, Ill. | 363,505 | 3.6% | $177,450 |
| 18 | Kalamazoo-Portage, Mich | 263,795 | 5.6% | $312,175 |
| 19 | Rockford, Ill. | 337,242 | 4.8% | $240,000 |
| 20 | Hartford-West Hartford-East Hartford, Conn. | 1,171,426 | 4.6% | $454,950 |
The top of the list
South Bend-Mishawaka holds the top spot for the second consecutive quarter. The spring 2026 top 10 reads like a tour of midsized industrial cities that the national housing conversation largely overlooked for a decade: South Bend, Appleton, Canton-Massillon, Lancaster, Springfield (MA), Akron, Manchester-Nashua, Lynchburg, Hagerstown, and Flint. These are not boomtowns. Most of these markets peaked industrially sometime in the mid-20th century and have spent the years since quietly rebuilding around healthcare, education, and manufacturing, industries that proved resilient through the COVID-19 pandemic and have continued to attract workers priced out of larger metros.
The common profile that links these markets is tight supply, above-average buyer demand, positive price appreciation, cost of living below the national baseline, and climate risk scores that cluster near the top of the index. That last factor, climate, is increasingly top-of mind for buyers as the cost of climate-related disasters, and insurance against them, rises. The top markets are overwhelmingly in the Midwest and mid-Atlantic, regions that face comparatively limited exposure to the hurricanes, flooding, wildfires, and extreme heat that are now measurably driving up insurance costs and depressing property values in markets farther south and west. The geography of climate risk and the geography of housing opportunity are beginning to overlap in important ways, creating opportunities for affordable, resilient housing.
Beyond the numbers, there’s a cultural thread running through many of these markets that the data captures only partly. Places like South Bend, Lancaster, and Hagerstown have a strong sense of local identity, anchored by universities, legacy industries, and tight-knit communities that tend to produce low turnover and stable demand.
Only four of this spring’s top 10—Canton-Massillon, Springfield (MA), Akron, and Manchester-Nashua—also appeared in last spring’s top 10. But the broader cluster has proven remarkably durable: Nine of last spring’s top 10 are still in this edition’s top 25. The story is not so much about individual market surges as it is about a corridor of midsized, affordable, climate-resilient cities, stretching from the Upper Midwest through the mid-Atlantic into New England, that are quietly consolidating their position as the most competitive housing markets in the country.
Spring 2026 holds relatively steady compared to spring 2025
The biggest year-over-year story is the one market that left the top entirely. Toledo, Ohio, which ranked No. 1 a year ago, now sits at No. 38. Price appreciation reversed sharply, from strong positive growth last spring to -12.7% year over year this quarter. When a market’s primary driver for being ranked highly is that homes are selling fast and getting more expensive, and then that momentum stalls, the ranking moves accordingly, and quickly. Toledo still sees high demand and a quick market pace, meaning it remains genuinely competitive, though prices have softened.
Toledo’s arc is instructive in a broader sense. The markets that topped last spring’s list were disproportionately driven by price momentum as rapidly appreciating homes in affordable Midwest cities were drawing national attention, first-time buyers, and investor interest simultaneously. Some of that momentum was sustainable, grounded in structural undersupply and growing demand, but some of it wasn’t. Toledo, Rockford (now No. 19), and Harrisburg (now No. 22) have eased back from the very top while remaining solidly in the upper third of the ranking. The markets that have moved into the top tier in their place tend to have more diversified profiles, including South Bend, Lynchburg, and Hagerstown, which all score well across multiple dimensions simultaneously rather than dominating in one or two.
Who’s in, who’s out?
Returning markets
Thirteen of this spring’s top 20 markets also appeared in last spring’s top 20, underscoring the structural consistency of the Midwest and mid-Atlantic corridor that has anchored this ranking for multiple consecutive quarters. The same fundamentals that elevated these markets a year ago—constrained supply, below-average cost of living, low climate risk, and steady demand—remain intact. If anything, the relative case for them has strengthened as Sun Belt markets remain soft.
| Market | Spring 2026 Rank | Spring 2025 Rank | Change |
| South Bend-Mishawaka, Ind.-Mich. | 1 | 15 | 14 |
| Appleton, Wis. | 2 | 14 | 12 |
| Canton-Massillon, Ohio | 3 | 5 | 2 |
| Lancaster, Pa. | 4 | 12 | 8 |
| Springfield, Mass. | 5 | 4 | −1 |
| Akron, Ohio | 6 | 6 | 0 |
| Manchester-Nashua, N.H. | 7 | 2 | −5 |
| Fort Wayne, Ind. | 11 | 13 | 2 |
| Reading, Pa. | 12 | 10 | −2 |
| Milwaukee-Waukesha, Wis. | 14 | 9 | −5 |
| Kalamazoo-Portage, Mich. | 18 | 20 | 2 |
| Rockford, Ill. | 19 | 3 | −16 |
| Hartford, Conn. | 20 | 8 | −12 |
Markets falling out of the top 20
Seven markets present in last spring’s top 20 have dropped out of that tier this spring, falling between 3 and 37 spots. The biggest mover is Toledo, Ohio, which fell 37 spots from No. 1 to No. 38. The remaining six have descended more modestly but meaningfully, with most landing in the 21–35 range, still competitive markets, but no longer standouts.
| Market | Spring 2026 Rank | Spring 2025 Rank | Change |
| Toledo, Ohio | 38 | 1 | −37 |
| New Haven, Conn. | 32 | 11 | −21 |
| Harrisburg-Carlisle, Pa. | 22 | 7 | −15 |
| Dayton-Kettering, Ohio | 29 | 19 | −10 |
| Worcester, Mass. | 23 | 16 | −7 |
| Green Bay, Wis. | 24 | 17 | −7 |
| Youngstown-Warren, Ohio | 21 | 18 | −3 |
New entrants to the top 20
Seven markets not in last spring’s top 20 have broken into that group this edition, climbing between 12 and 89 spots. All seven are in the Midwest, mid-Atlantic, or New England, continuing the geographic concentration that has defined the top of this ranking.
| Market | Spring 2026 Rank | Spring 2025 Rank | Change |
| Flint, Mich. | 10 | 99 | 89 |
| Lynchburg, Va. | 8 | 57 | 49 |
| Norwich-New London, Conn. | 16 | 52 | 36 |
| Springfield, Mo. | 15 | 50 | 35 |
| Peoria, Ill. | 17 | 44 | 27 |
| Hagerstown-Martinsburg, Md.-W.Va. | 9 | 23 | 14 |
| Lansing-East Lansing, Mich. | 13 | 25 | 12 |
Flint’s rise from No. 99 to No. 10 is the single largest jump of any market entering the top 20, driven by the highest year-over-year price appreciation in the entire 200-market ranking at +27.6%. That number warrants a note of caution as rapid appreciation from a very low price base can reflect genuine demand momentum but could be volatile, and Flint’s improvement deserves monitoring in subsequent quarters.
The bottom of the list: Florida, Texas, and the retreat of the Sun Belt
If the top of this ranking tells a story about the quiet rise of midsized Midwest and mid-Atlantic cities, the bottom tells of the slow but measurable retreat of Sun Belt markets that spent a sizable chunk of time as the country’s hottest real estate destinations.
The numbers are stark. Eleven of the bottom 25 markets are in Florida. Nine are in Texas. Together, Florida and Texas account for 80% of the bottom quartile, a geographic concentration that would have been almost unthinkable five years ago, when both states were struggling to keep up with the massive influx in housing demand. The problem is not that these markets have become expensive in the traditional sense. Most of them still have below-average home prices. The problem is that they are flush with inventory but do not offer the bang for your buck they once did.
Supply has flooded back into Florida and Texas at a rate that demand has been unable to absorb. The bottom 25 markets see homes spend significant time on the market, averaging 66 days to the top 20’s 40 days in March. Prices are reflecting that imbalance. The average price trend across the bottom 25 is -2.6% year over year, while the top 25 average +2.8%.
Florida’s Gulf Coast is the most concentrated trouble spot. Cape Coral, Ocala, Port St. Lucie, Crestview-Fort Walton Beach, North Port-Sarasota, Naples, Tampa, Jacksonville, Deltona-Daytona Beach, Lakeland, and Orlando all appear in the bottom 25. These are diverse cities—some retiree-heavy, some family-oriented, some with strong job markets—but they share a common vulnerability that the ranking now makes visible: climate risk. The bottom 25 markets average a climate risk score of 0.99 out of 1.0, meaning essentially every property in these metros faces elevated exposure to hurricanes, flooding, or extreme heat. The national average is 0.46. That difference means that homeowners insurance in coastal Florida has become, in many cases, functionally unaffordable or unavailable, and the rising cost of carrying a property, including insurance, flood mitigation, and utilities in a warming climate, is beginning to show up in prices, turnover rates, and the ranking itself.
Texas tells a somewhat different version of the same story. Markets like Austin (-8.8% year-over-year price growth, the steepest decline in the ranking), McAllen, Corpus Christi, San Antonio, Houston, and Killeen are not primarily climate stories; they are supply stories. The building boom that swept Texas through the pandemic years left many of these markets with more homes than they currently have buyers, given prices and rates. That oversupply is gradually working itself through, but the process takes time; in the interim, these markets score poorly on the price trend and supply dimensions. Austin’s shift away from being one of the hottest markets in the country is perhaps the starkest illustration of how quickly conditions can reverse when supply constraints dissolve.
The deeper point is that the bottom of this ranking captures something the national affordability narrative often misses: Price alone does not determine value. A home in Cape Coral at a below-median price, subject to hurricane risk, rising insurance costs, and declining neighborhood values, may represent a worse financial proposition than a modestly more expensive home with low taxes, a short commute, and a stable market. The ranking is measuring total quality-of-life value, and by that measure, the Sun Belt’s moment of dominance is, at least for now, a thing of the past.
Spotlight: South Bend-Mishawaka, IN-MI
| March 2026 | March 2026
YoY % Change |
March 2026 vs. Pre-Pandemic (2017-’19) | |
| Median List Price | $317,450 | +27.5% | +71.8% vs 2019 |
| Active Listings | 508 | -9.5% | -40.7% |
| Days on Market | 47 | -6 days | -21 days |
| New Listings | 402 | +10.4% | -6.1% |
The affordability that makes South Bend compelling to homebuyers today is, in part, a product of steady growth and appreciation. The infrastructure, the University of Notre Dame’s economic and cultural anchor, the manageable scale of the metro, all of it was invested in over time. The current moment is when that foundation is being discovered.
By every major dimension of this ranking, South Bend is performing at or near its best. Price appreciation is running at +21.1% year over year, the second highest among all 200 metros. Critically, it is appreciation happening on a base that remains affordable. The typical home spent 47 days on the market in March, 10 days less than the national median. The typical home for sale attracted about 15.6% more views per property than the large-metro median. The combination of the two suggests strong competition for homes rather than the kind of momentum-driven froth that has historically preceded corrections.
The cost-of-living profile reinforces the value proposition at every level. South Bend’s regional price parity index of 92.9 means that everyday costs like groceries, services, and utilities run roughly 7% below the national average. The effective property tax rate of 0.84% is modest by national standards. The average commute of 21.8 minutes compares favorably to virtually every major metro in the country. Buyers here are getting not just a cheaper house, but also a less expensive life.
Climate risk deserves particular attention. Just 4.9% of South Bend properties face elevated climate risk, placing it among the most climate-resilient markets in the country. As the bottom of this ranking fills with Florida and Gulf Coast markets weighed down by hurricane and flood exposure, South Bend sits at the opposite end of the spectrum. The same Great Lakes geography that once made the city feel remote from the country’s economic energy is increasingly looking like a durable physical advantage.
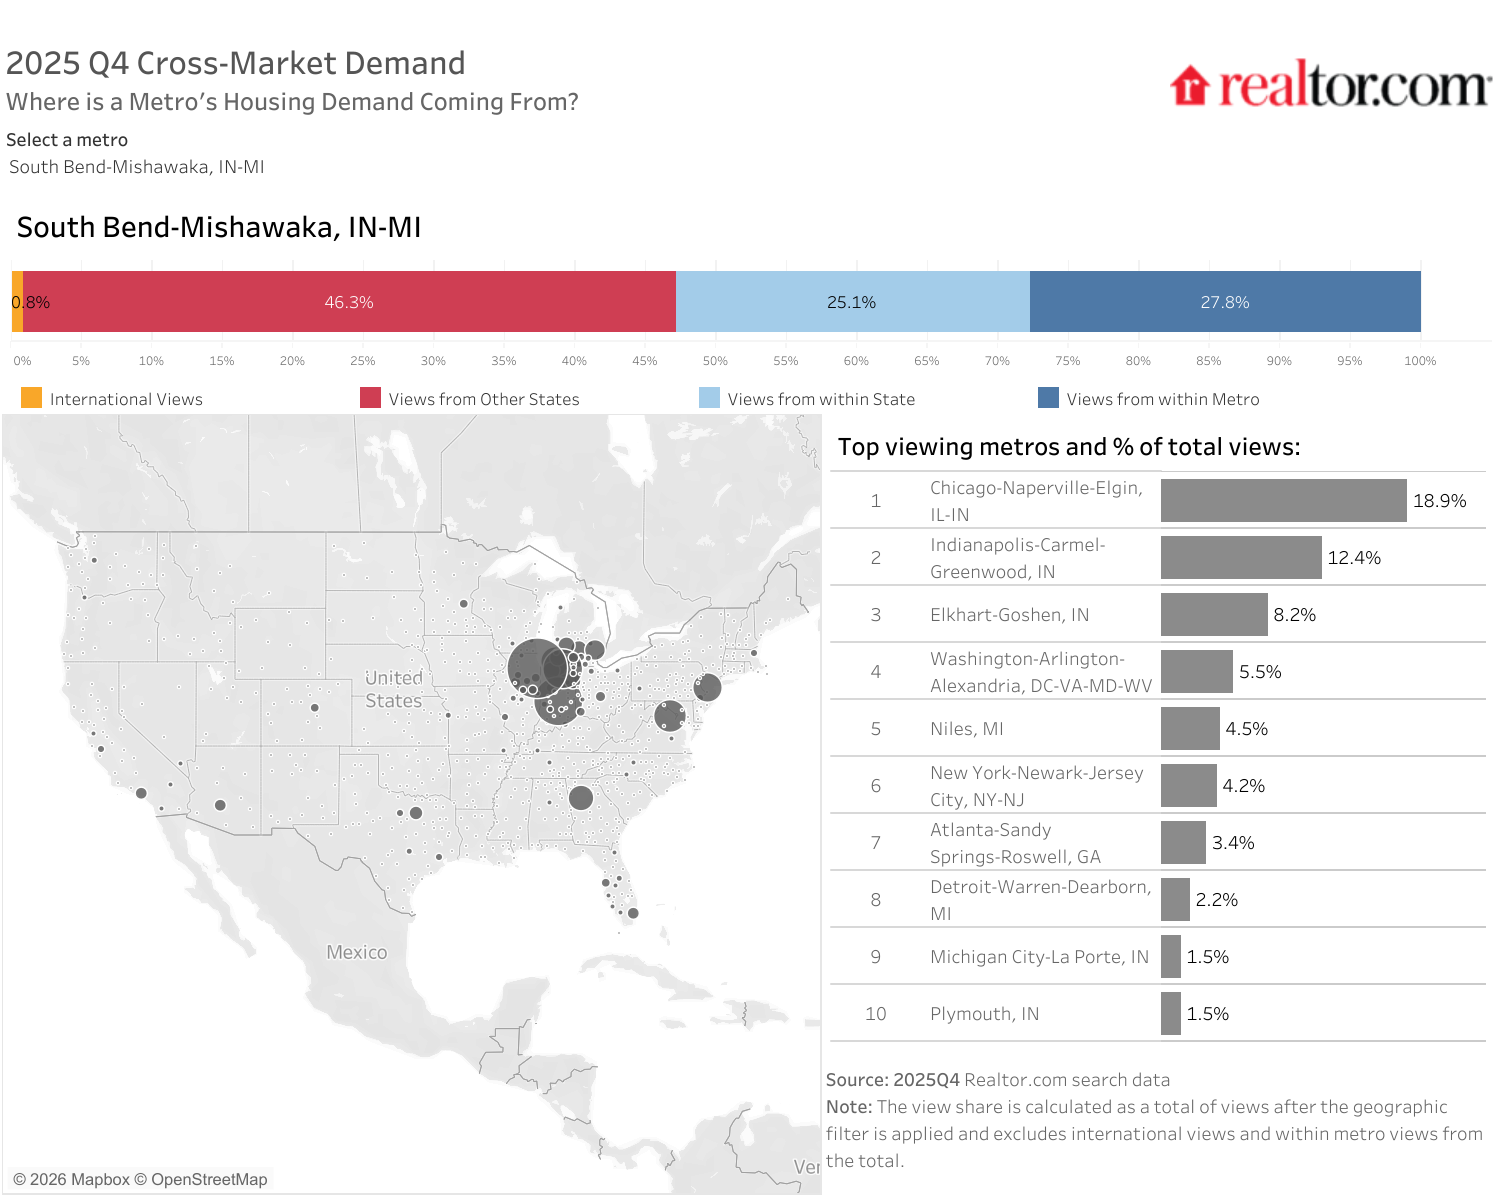
South Bend punches well above its weight in the density of everyday services relative to population. The Notre Dame ecosystem draws restaurants, fitness facilities, specialty retailers, and service providers that a city of 325,000 would not typically sustain. The recent investment in the downtown riverfront and the Howard Park revitalization has helped to raise a quality-of-life profile that increasingly matches what buyers from larger cities say they are looking for when they describe their ideal affordable market. As a result, South Bend draws significant demand from nearby Chicago and Indianapolis, as well as DC, New York City, and Atlanta further down the list.
For now, South Bend represents a market where affordability, livability, and demand momentum are not in tension with one another but compounding. Toledo demonstrated last spring that price momentum alone is a fragile foundation. South Bend’s advantage is that its momentum is broad-based, built on low costs, strong demand, climate resilience, and genuine livability rather than any single headline number. That is the kind of market that tends to stay at the top of rankings like this one, and the kind of market that is increasingly hard for buyers to argue against.
Methodology
The ranking evaluates the 200 most populous core-based statistical areas, as measured by the U.S. Census Bureau, and defined by July 2023 OMB delineation standards for eight indicators across two broad categories: real estate market (60%) and economic health and quality of life (40%). Each market is ranked on a scale of 0 to 100, according to the category indicators, and the overall result is based on the weighted sum of these rankings. The real estate market category indicators are real estate demand (15%), based on average page views per property; real estate supply (15%), based on median days on the market for real estate listings; median listing price trend (10%), based on annual price growth over the quarter; property taxes (10%); and climate risk to properties (10%). The economic and quality-of-life category indicators are unemployment (5%); wages (5%); regional price parities (5%); the share of foreign-born (5%); small businesses (5%); amenities (10%), measured as the average number of stores per specific “everyday splurge” category (coffee, upscale/specialty grocery, home improvement, fitness) per capita in an area; and commute time (5%).

