


Welcome to this weekly housing trends update, where we bring you the latest snapshot of inventory trends, listing activity, and buyer-seller dynamics across the U.S. housing market.
In addition to our monthly housing trends reports, which offer deeper insights into long-term patterns, we publish these weekly updates to provide more timely views into market changes. This effort began in response to rapid shifts in the economy and housing landscape.
You can count on a new Weekly Housing Trends update, fresh weekly data each Thursday, and a weekly video from our economists to help you stay informed.
What this week’s data shows
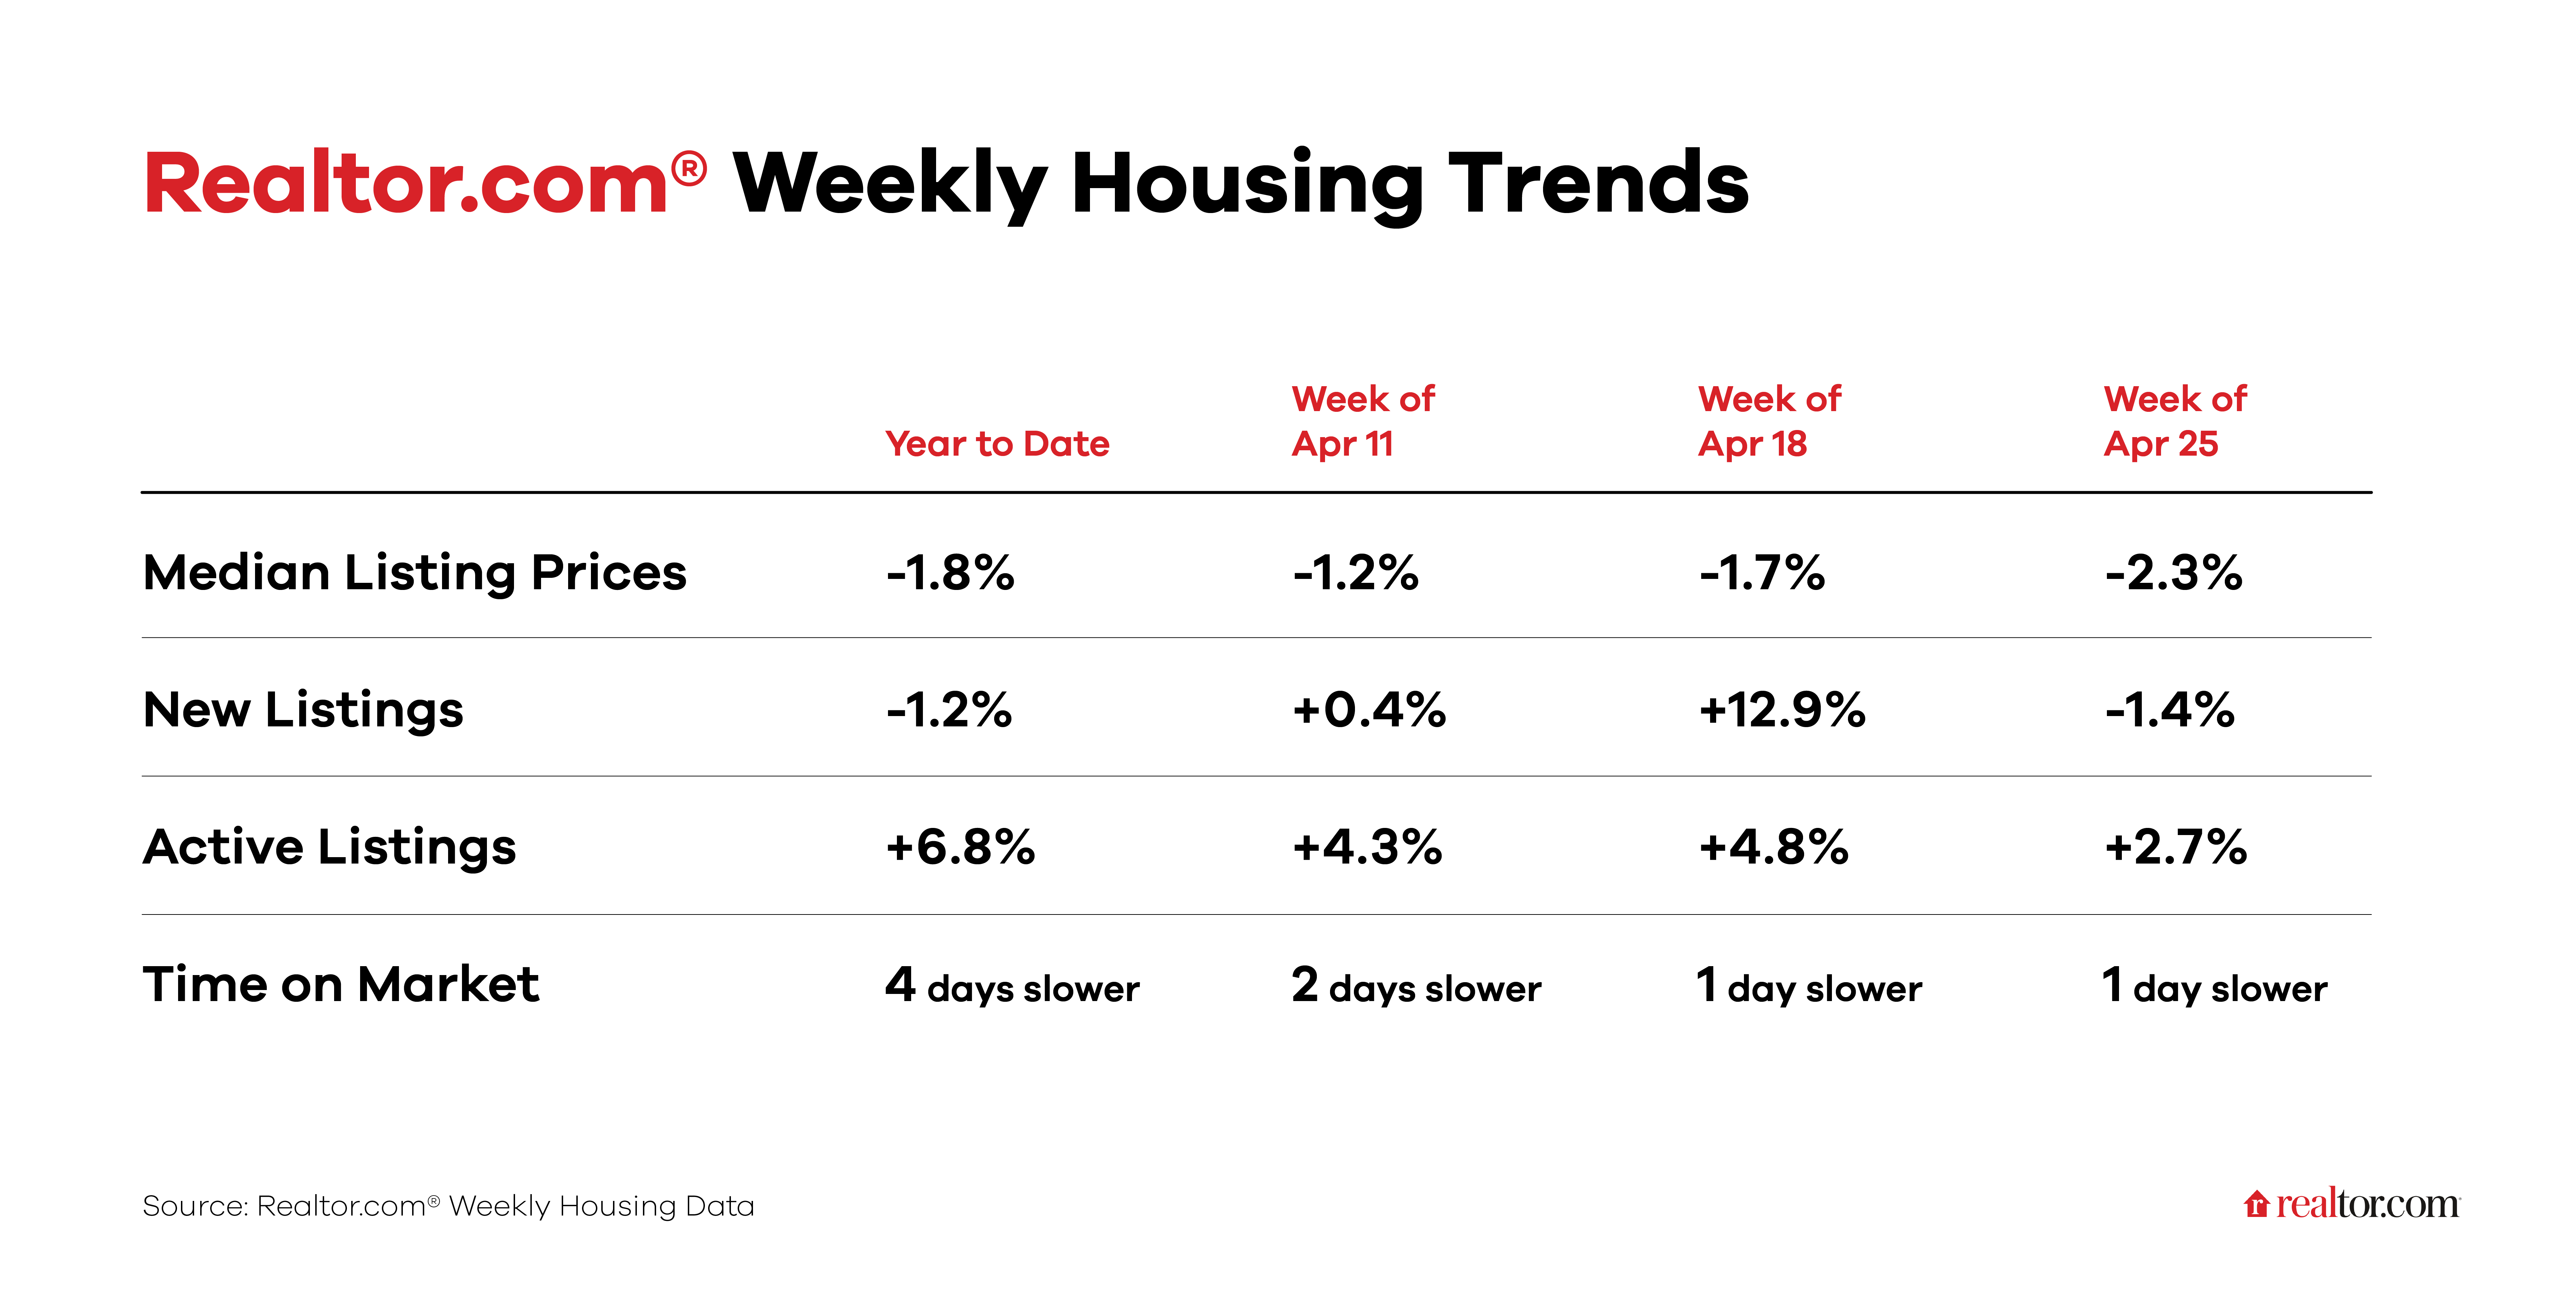
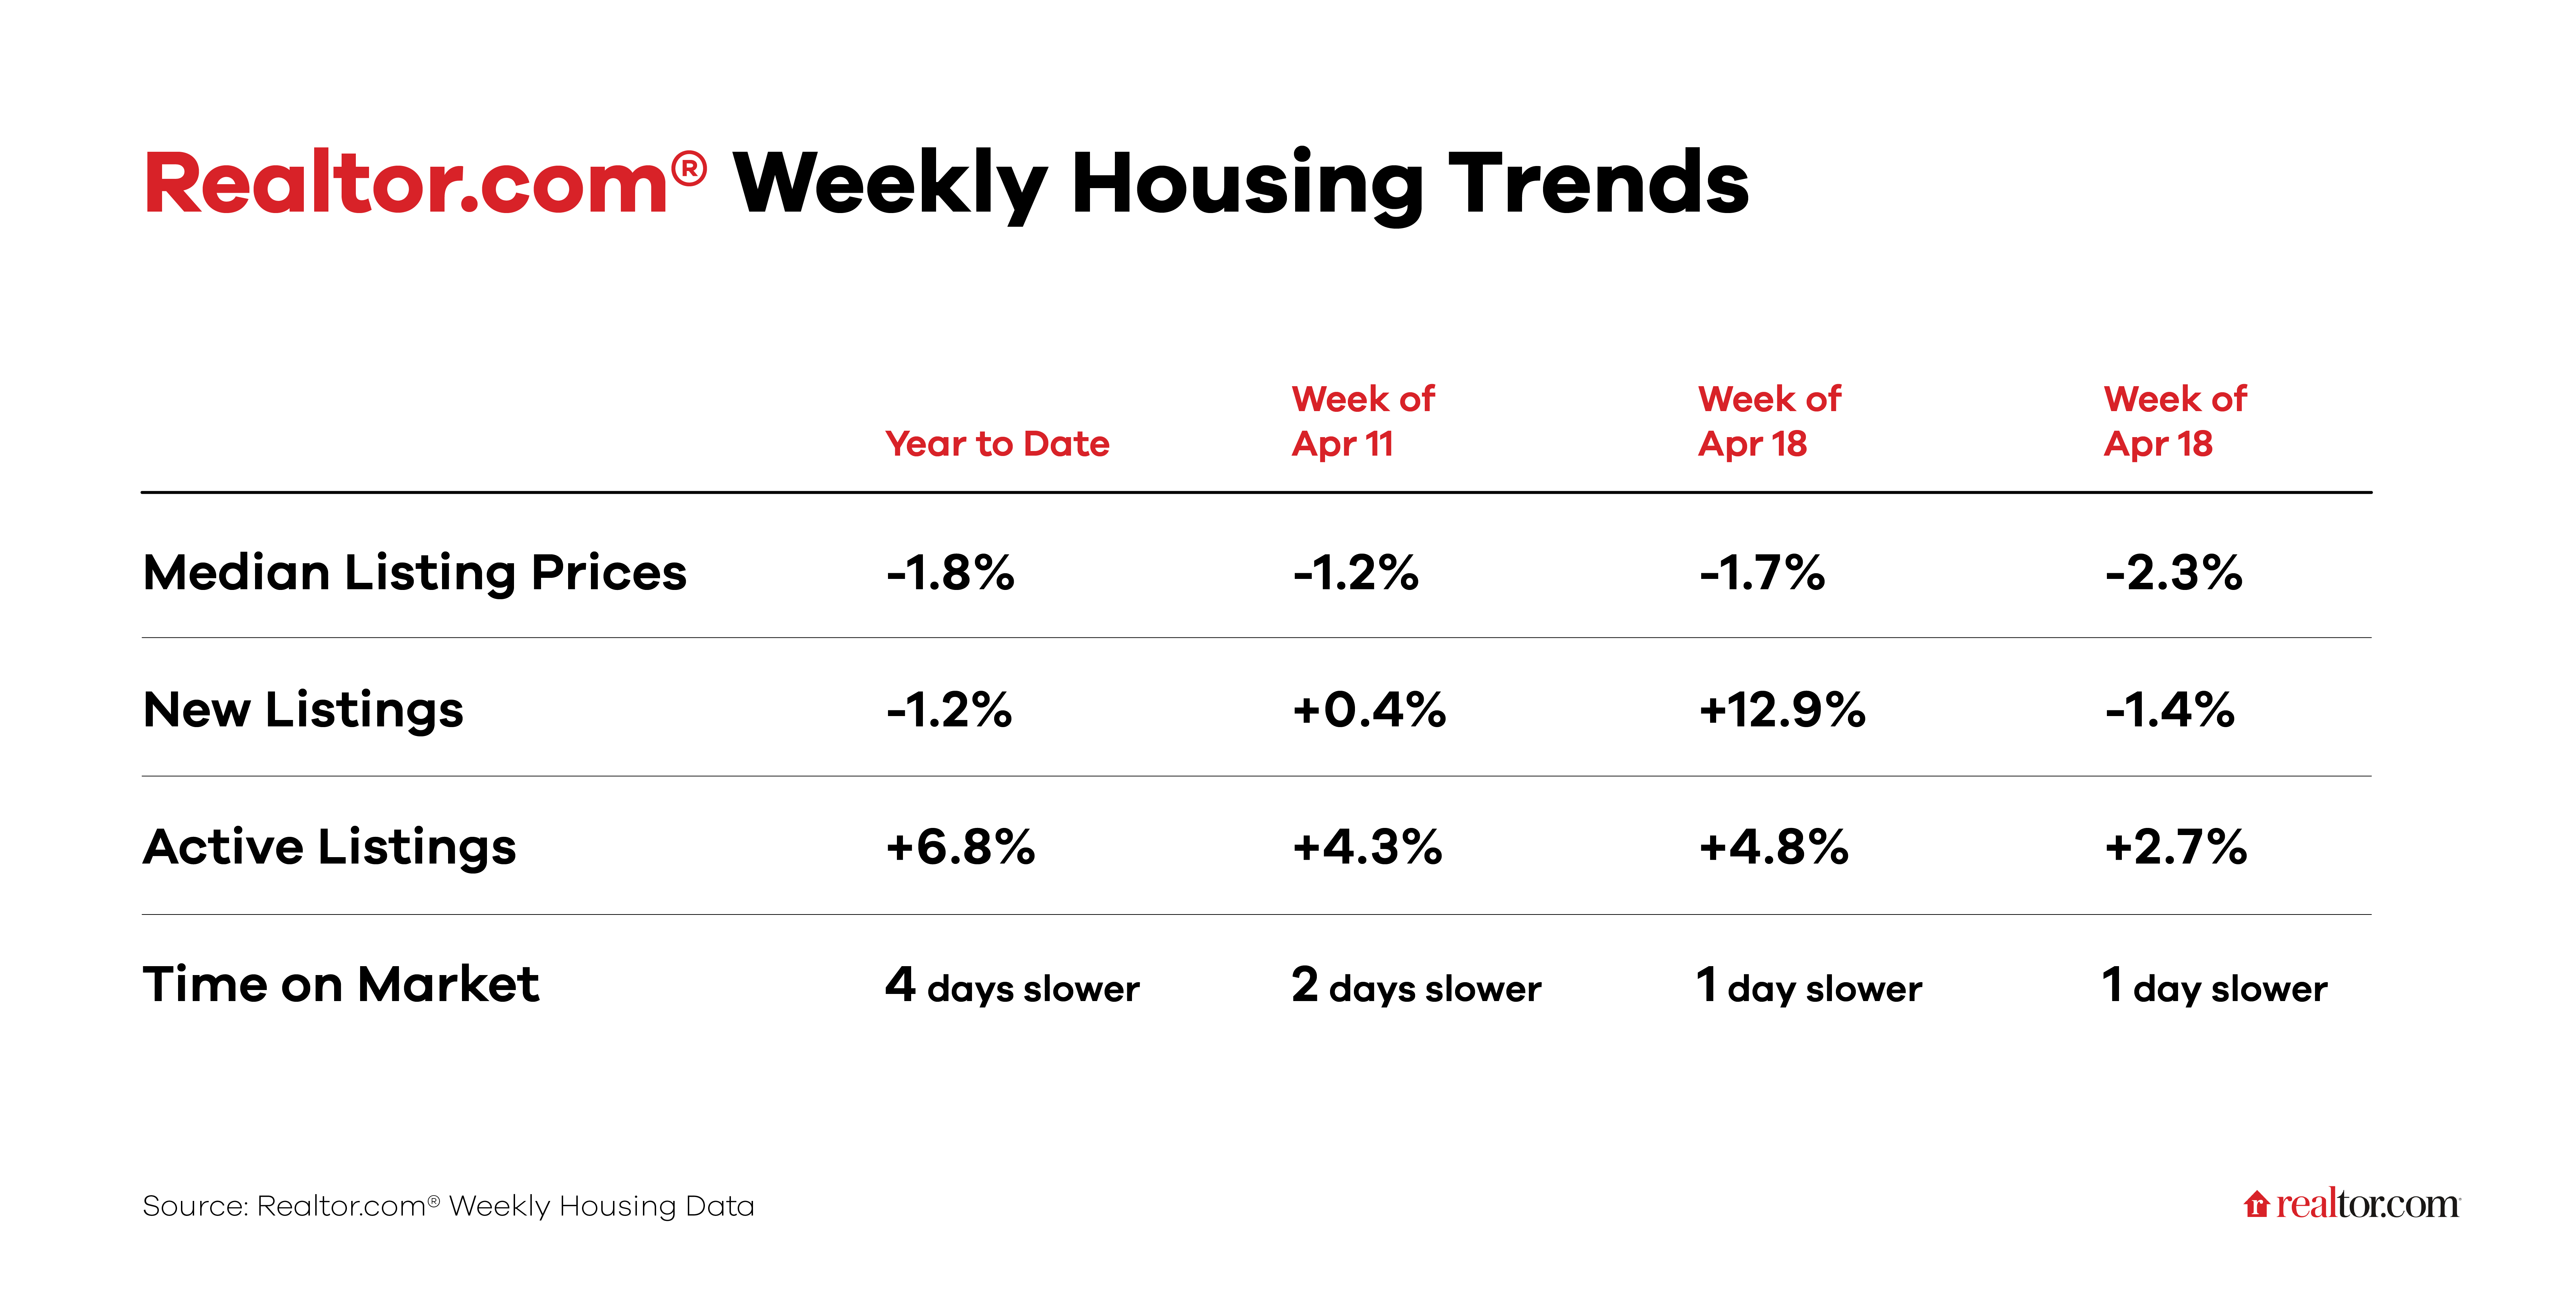
New listing activity pulled back this week following last week’s Easter-driven surge, landing at a 1.4% year-over-year decline. Those two figures are really just two sides of the same calendar coin. Elsewhere, the buyer-friendly spring story remains intact: Inventory continues to build, asking prices are softening further, and homes are still moving at a pace that’s keeping the market from tipping into stagnation.
Weekly housing trends highlights
New listings, a measure of sellers putting homes up for sale, fell 1.4% year over year
Last week’s 12.9% gain and this week’s 1.4% dip are best read together. Easter fell during the week of April 25 last year, keeping sellers on the sidelines and creating a favorable comparison base for this week’s read. With that holiday distortion now cleared, the underlying picture looks like a market where sellers are gradually reengaging at a measured, sustainable pace.
Active inventory climbed 2.7% year over year
The number of homes for sale continues to exceed year-ago levels, though the rate of growth has moderated from the 4.8% and 4.3% gains of the prior two weeks. Year to date, active inventory is running 6.8% above the same period one year ago. The slowdown in the weekly comparison likely reflects buyers absorbing available supply rather than any pullback in seller activity.
Homes spent 1 day longer on the market than a year ago
Time on the market has been running just one day behind last year’s pace, and that gap has been narrowing throughout the year, a sign that buyer demand is absorbing the growing supply rather than letting it pile up.
The median listing price fell 2.3% year over year
Asking prices have now fallen or held flat for 27 consecutive weeks, with this week marking the 15th straight week of outright year-over-year price declines. The deepening decline, from -1.7% last week to -2.3% this week, comes even as inventory growth is moderating and homes are selling at a pace close to last year’s. That combination suggests sellers are adjusting prices to attract buyers rather than waiting for the market to come to them, a dynamic that keeps the spring window genuinely competitive for shoppers.

