


Highlights
- New-construction prices are flat year over year, but existing-home prices are falling, driving up the new-construction premium nationally to 15.1%.
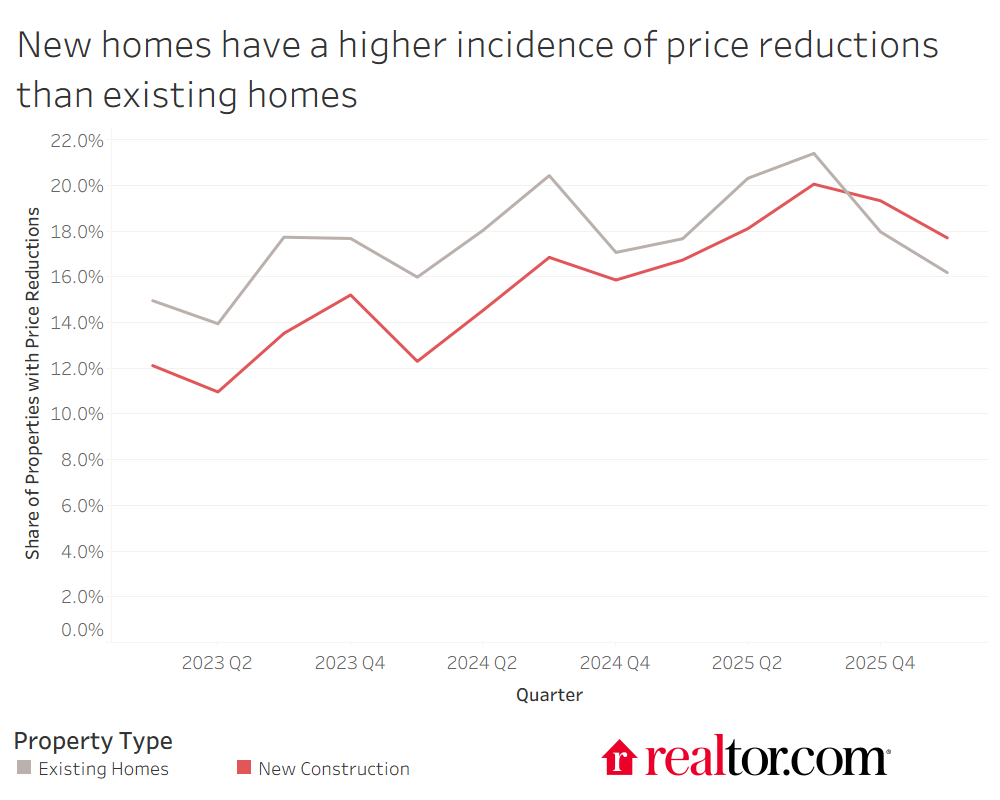
- New builds on the market saw price reductions at a higher rate than existing homes for a second quarter, reflecting demand weakness and active price management by builders to account for it.
- A vast majority of new builds are in suburban ZIP codes, though some metropolitan areas have over 50% of their new builds in urban areas.
- The new-construction premium is much higher in urban ZIP codes than in suburban ones, reflecting both the demand for new builds in those areas and the difficulty of delivering them.
National overview
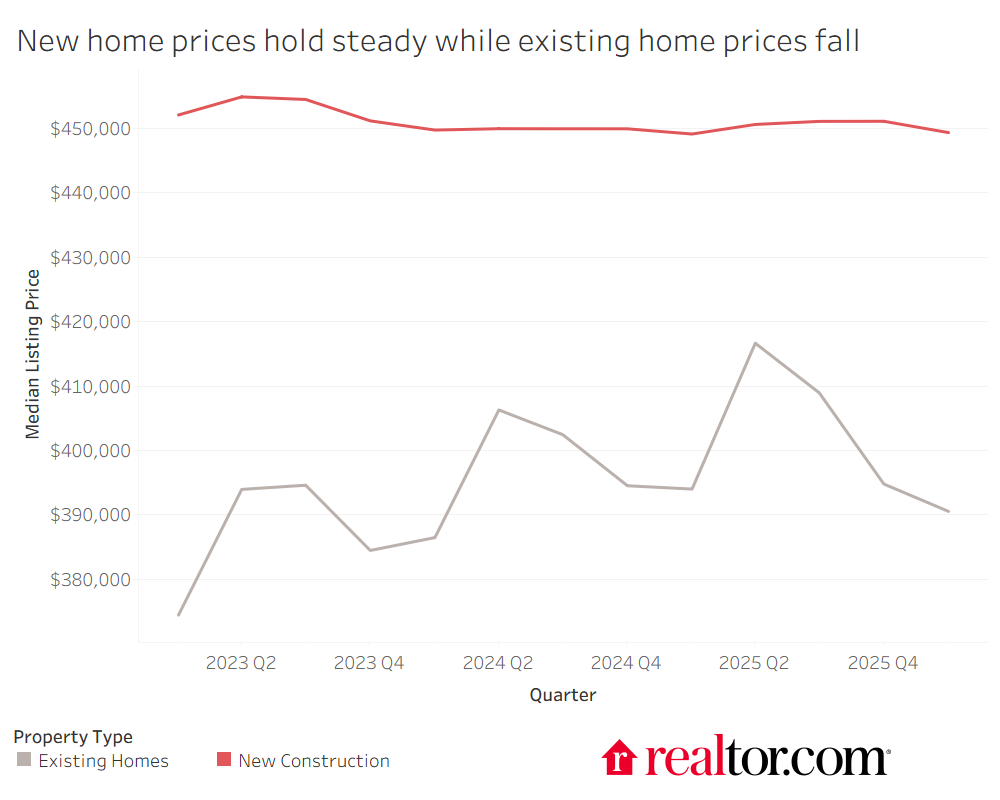
The median listing price for new-construction homes dipped from the fourth quarter of 2025 into the first quarter of 2026, coming in at $449,373. The quarter-to-quarter decline was an expected seasonal shift, and the first quarterly readout of 2026 is actually right in line with where prices were one year ago at this time ($449,150). New-construction prices are flat, but existing-home prices are starting to fall in a noticeable way, down 0.9% year over year to $390,550.
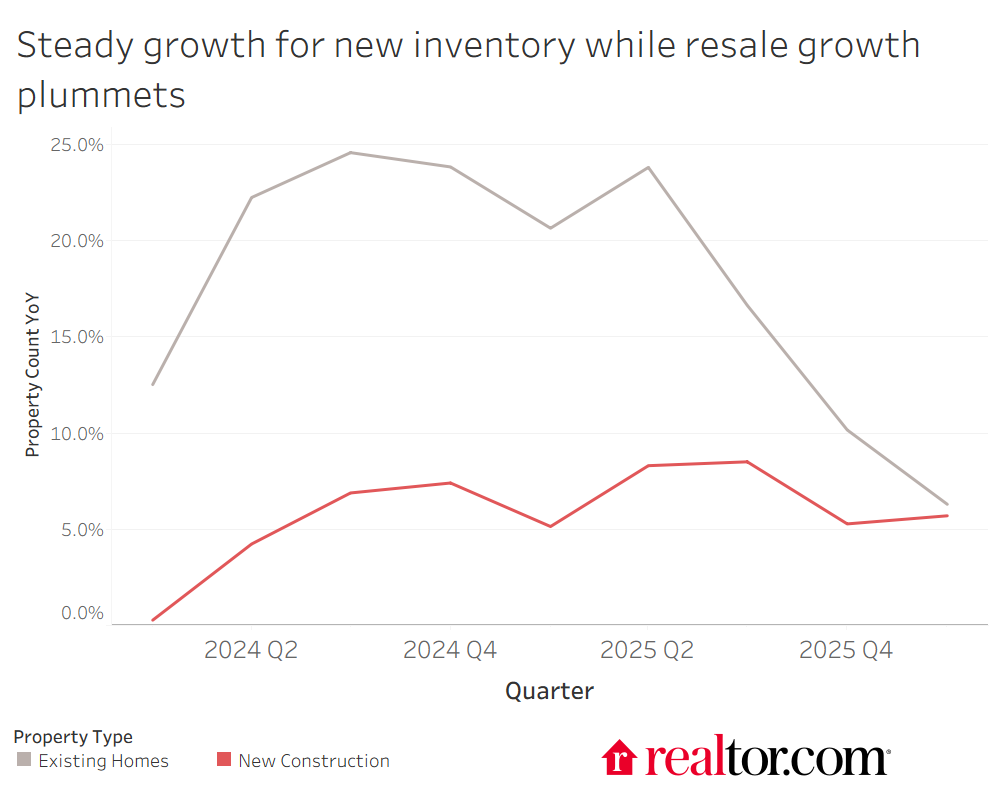
Existing-home prices are falling even as the number of existing homes for sale is starting to grow at its slowest pace in years, signaling some demand softness in this segment resulting from high mortgage rates and consumer uncertainty. New-construction inventory growth has held steady in the 5% to 9% range year over year, and existing-home inventory growth is slowing to match it.
For the second quarter in a row, new homes on the market have had their prices reduced at a higher rate than existing homes. That this is occurring at the same time that prices overall for new construction have held steady suggests that builders are actively managing prices on their inventory, starting them higher and adjusting down to meet buyers where they are.
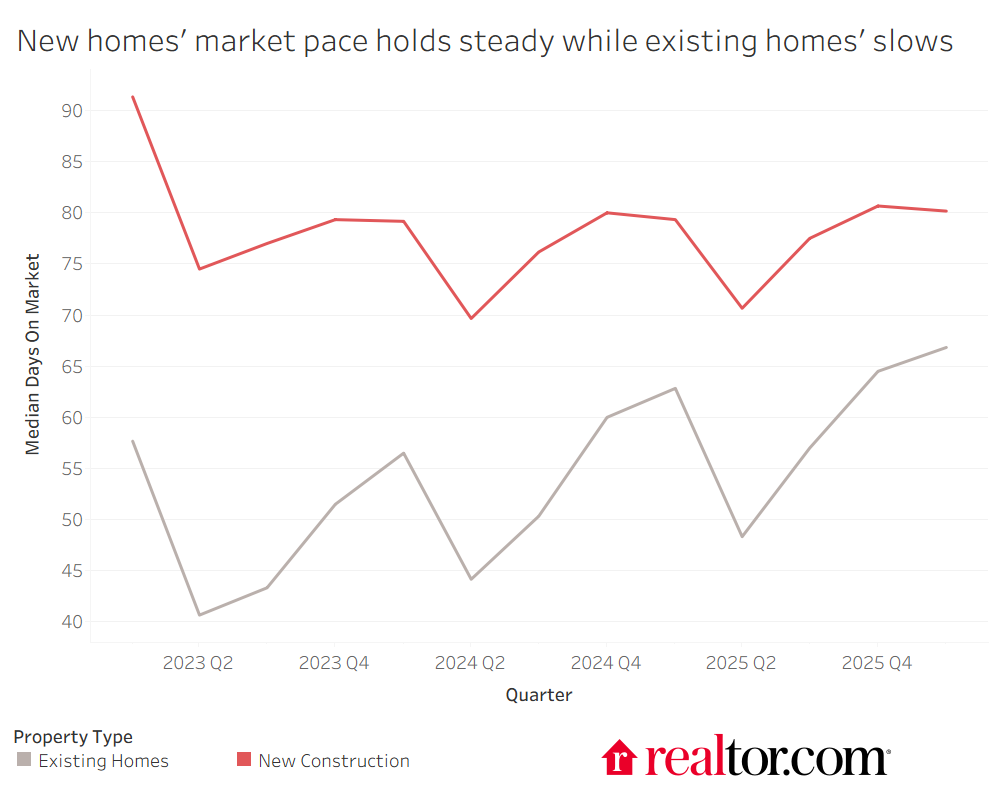
This active price management has not added to time on the market, which has held constant (though at a higher level) for new construction even as the existing-home market’s pace continues to slow.
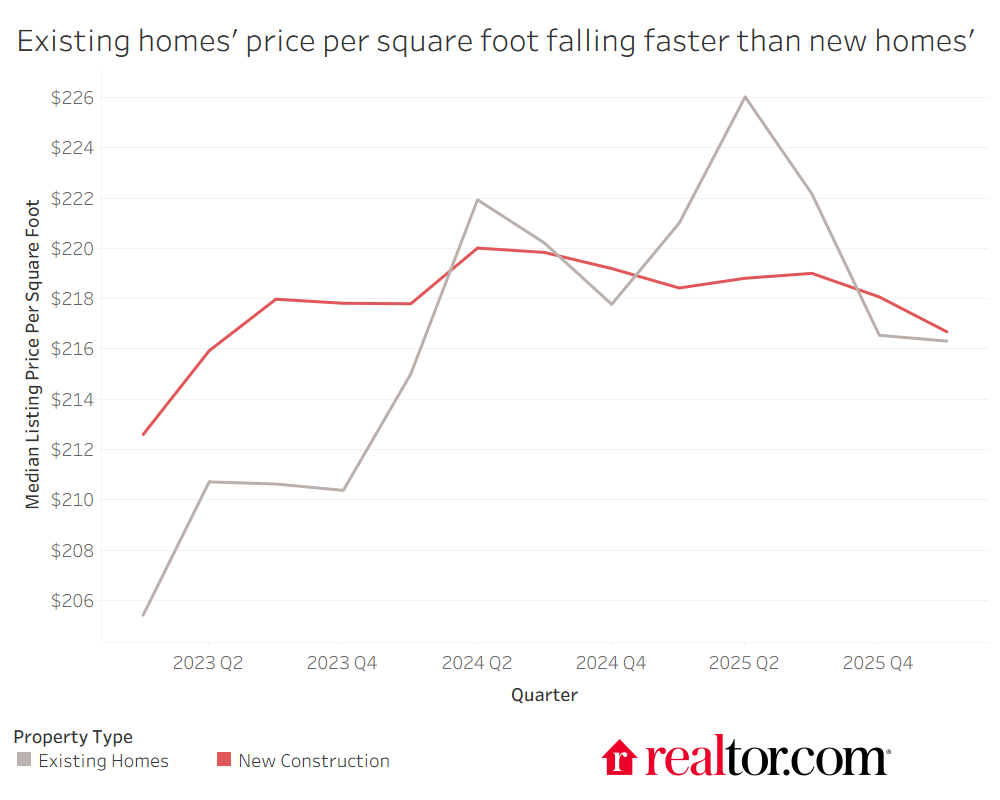
The price per square foot, a measurement of the underlying value of homes for sale, is falling for both new construction and existing homes. The market had been showing the unusual result of price per square foot being higher for existing homes than for new homes for most of 2025, but the past two quarters have returned this measure to its expected territory with new homes commanding a higher price per square foot ($217) than existing homes ($216). The return to normalcy is due to a large drop ($5 per square foot) year over year in existing-home price per square foot coinciding with a smaller one for new homes ($1 per square foot).
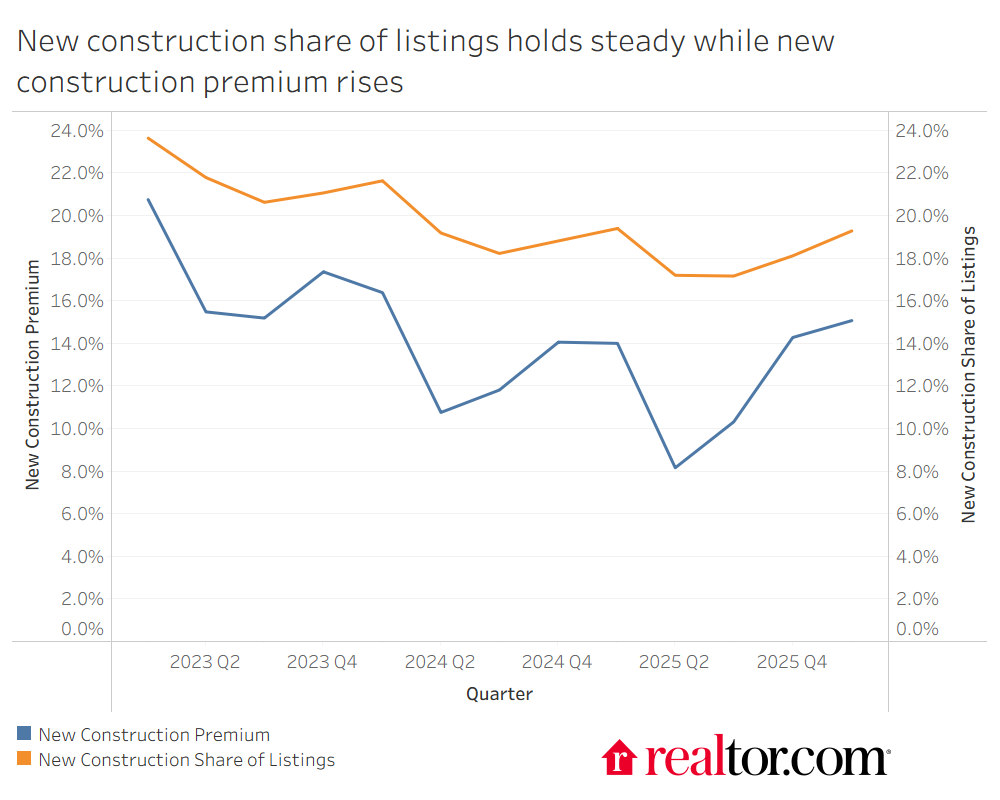
The slowdown in existing homes coming on the market and the retreat in existing-home prices have led to the share of new-construction listings on the market holding basically steady at 19.3% (compared to 19.4% last year at this time) and the new-construction premium increasing slightly to 15.1% (from 14.0% last year).
In all, the market of new homes for sale has displayed exceptional stability in recent quarters and years, even as the existing-home market has been much more volatile. This all comes as builders face significant headwinds in terms of their growing costs of labor and materials and the affordability-constrained buyers they must compete with the existing-home segment over.
Urbanicity analysis
To better understand how the market for new homes compares to the market for existing homes, we take a closer look at where the homes are located. Namely, we categorize every ZIP code in the United States into one of four categories based on government designation for rural areas, the population density of the ZIP code, its membership in a major metropolitan area, and its friendliness toward pedestrians and public transportation. With these designations of Rural, Suburban, Town, and Urban in hand, we look at each property for sale during the first quarter of 2026 and assign it a category based on its ZIP code.
The first finding is that new-construction homes for sale are overwhelmingly located in suburban areas. Nearly 80% of new homes for sale are suburban, compared to just over 55% of existing homes.
Properties for Sale by Urbanicity of ZIP Code
| Rural | Suburban | Town | Urban | |
| New Construction | 1.2% | 79.8% | 8.0% | 10.9% |
| Existing Homes | 3.9% | 55.7% | 10.7% | 29.7% |
Coinciding with this finding is that new construction is under-represented in urban areas. Nearly 30% of existing homes for sale are in urban ZIP codes, but just over 10% of new-construction homes are. These are some expected results, as land is much more readily available for new construction in suburban areas than urban ones and a large percentage of new-construction homes for sale are built in new-construction communities on the outskirts of town rather than on individual lots in the city.
Though nationally most new construction is not urban, there are seven metros where a majority of the new homes for sale are in urban ZIP codes. These are mostly big cities with lots of ZIP codes classified as urban and without much empty land surrounding them, and also metros with high shares of condos, which tend to be built closer to city centers. The urban share of resale listings in each of these metros except San Francisco are all higher than the new-construction urban share, indicating that these metros are located in urban areas rather than there being a pattern for new construction to pop up in those ZIP codes. In San Francisco, urban infill construction actually makes new construction more urban than resale listings. The urban concentration of new-construction listings in these metros also leads each of the seven to have a higher new-construction premium than the national average.
| Metro Area | Urban Share of New-Construction Listings | New-Construction Premium | Urban Share of Resale Listings |
| New York-Newark-Jersey City, NY-NJ | 69.6% | 106.8% | 71.3% |
| Miami-Fort Lauderdale-West Palm Beach, FL | 69.5% | 305.2% | 79.6% |
| San Francisco-Oakland-Fremont, CA | 68.9% | 30.1% | 67.0% |
| Los Angeles-Long Beach-Anaheim, CA | 68.8% | 42.4% | 77.5% |
| New Orleans-Metairie, LA | 62.4% | 24.9% | 73.1% |
| Urban Honolulu, HI | 53.8% | 29.2% | 66.4% |
| San Diego-Chula Vista-Carlsbad, CA | 53.4% | 23.5% | 61.2% |
On the flip side, 9 of the 10 metro areas with the lowest new-construction premium (6 of them negative, indicating that new construction is less costly than existing homes) have an urban share of new-construction listings below 10%.
| Metro Area | Urban Share of New-Construction Listings | New-Construction Premium | Urban Share of Resale Listings |
| Cape Coral-Fort Myers, FL | 2.9% | -13.5% | 17.0% |
| North Port-Bradenton-Sarasota, FL | 12.2% | -7.7% | 26.2% |
| Austin-Round Rock-San Marcos, TX | 8.6% | -6.0% | 29.6% |
| Pensacola-Ferry Pass-Brent, FL | 7.0% | -5.7% | 13.9% |
| Boise City, ID | 3.0% | -4.8% | 15.1% |
| Greenville-Anderson-Greer, SC | 9.2% | -0.5% | 10.6% |
| Deltona-Daytona Beach-Ormond Beach, FL | 4.8% | 2.6% | 23.2% |
| Raleigh-Cary, NC | 7.6% | 2.9% | 21.9% |
| Phoenix-Mesa-Chandler, AZ | 9.5% | 4.0% | 42.5% |
| Jacksonville, FL | 7.7% | 4.1% | 22.4% |
This shows a direct connection between where new homes are being built and how competitively those homes are being priced. It’s easy to say that new construction is a more affordable option in markets like Austin, TX, but where those new homes are doesn’t really compare to where the existing homes are (29.6% of which are in urban ZIP codes). Again, in each of these metros, the stock of resale homes is significantly more urban than the stock of new-construction homes, which drives down the new-construction premium. It’s important to understand this context when comparing prices of existing homes and new homes, as we will below.
Median Listing Price by Urbanicity of ZIP Code
| Rural | Suburban | Town | Urban | |
| New Construction | $459,000 | $427,900 | $389,000 | $738,662 |
| Existing Homes | $299,000 | $399,900 | $309,000 | $414,000 |
Nationally, the highest new-construction premium is commanded by urban new builds, which are priced 78.4% higher than urban existing homes. These urban ZIP codes are generally more desirable and have an older stock of existing homes in them, which combine with the difficulty of building new homes in these densely populated ZIP codes to allow new construction in urban areas to charge higher prices. Conversely, the new-construction premium in suburban ZIP codes is just 7.0%. Suburban new builds are much easier to come by than urban new builds and are less distinguishable from their newer neighboring existing homes, so they have to be much more competitive on price. In addition, suburban new builds are highly concentrated in the South region, where listing prices tend to be lower.
Below are the 10 metros with the highest premium on their urban new construction. In each, urban new builds are priced at least double the median listing price of urban existing homes. This is an interesting mix of expensive coastal metros and affordable inland ones, showcasing that all types of cities have demand for new urban homes.
| Metro Area | Urban New-Construction Median Listing Price | Urban Existing-Home Median Listing Price | Urban New-Construction Premium |
| Miami-Fort Lauderdale-West Palm Beach, FL | $2,578,695 | $459,000 | 461.8% |
| North Port-Bradenton-Sarasota, FL | $1,639,990 | $408,000 | 302.0% |
| Tampa-St. Petersburg-Clearwater, FL | $1,182,600 | $390,000 | 203.2% |
| St. Louis, MO-IL | $575,000 | $189,950 | 202.7% |
| Detroit-Warren-Dearborn, MI | $511,180 | $185,000 | 176.3% |
| Chicago-Naperville-Elgin, IL-IN | $889,000 | $329,900 | 169.5% |
| Cincinnati, OH-KY-IN | $699,950 | $260,000 | 169.2% |
| New York-Newark-Jersey City, NY-NJ | $1,510,000 | $699,000 | 116.0% |
| Raleigh-Cary, NC | $1,053,423 | $489,000 | 115.4% |
| Orlando-Kissimmee-Sanford, FL | $684,000 | $320,000 | 113.8% |
New construction is largely a suburban story across the country, but urban infill is a significant and lucrative portion of the industry. As pressure mounts on local jurisdictions to allow for more new construction in cities by streamlining permitting and adopting more permissible zoning laws, the price signals for urban building will lead more builders to chase these higher-priced homes.
Methodology
Realtor.com housing data as of March 2026. Listings include the active inventory of newly built single-family homes and condos/townhomes/row homes/co-ops for the given level of geography on Realtor.com. Realtor.com new-construction data history goes back to January 2023. ZIP codes are categorized based on RUCA codes from the U.S. Department of Agriculture, household counts, and square mileage provided by Claritas, and pedestrian/public transit scores provided by Local Logic.

