


Highlights
- National luxury prices remain below year-ago levels, with the top 10% of homes starting at $1,274,423 in April, down 1.9% from April 2025.
- The national share of million-dollar listings edged down slightly to 13.5%, 0.6 percentage points below the April 2025 level.
- The luxury segment is actively scaling in emerging luxury markets, including Fayetteville-Springdale-Rogers, AR (+37.7% YoY in million-dollar listings), Durham-Chapel Hill, NC (+23.7%), and Colorado Springs, CO (+17.8%)
- New York City reclaimed the top spot in million-dollar listing count over Miami in April, consistent with its well-established spring inventory surge. Miami’s longer-run trajectory, however, points to a structural deepening of its luxury market and will remain a top luxury destination within the U.S.
- Market spotlight on Kiryas Joel-Poughkeepsie-Newburgh, NY: this Hudson Valley metro is quietly building one of the more intriguing emerging luxury profiles in the Northeast, anchored by a corridor of estate-driven communities across Dutchess County and Orange County, from the equestrian farmlands of Amenia and Pine Plains to the historic enclave of Tuxedo Park.
National Luxury Overview
| Pricing | April 2026 | Monthly Change | YoY Change |
| Luxury Threshold 90th Percentile | $1,274,423 | 2.0% | -1.9% |
| High-End Luxury Threshold 95th Percentile | $2,003,139 | 0.3% | -5.9% |
| Ultra Luxury Threshold 99th Percentile | $5,711,785 | -1.0% | -3.7% |
| Million-Dollar Listing Share | 13.5% | -0.4pp | -0.6pp |
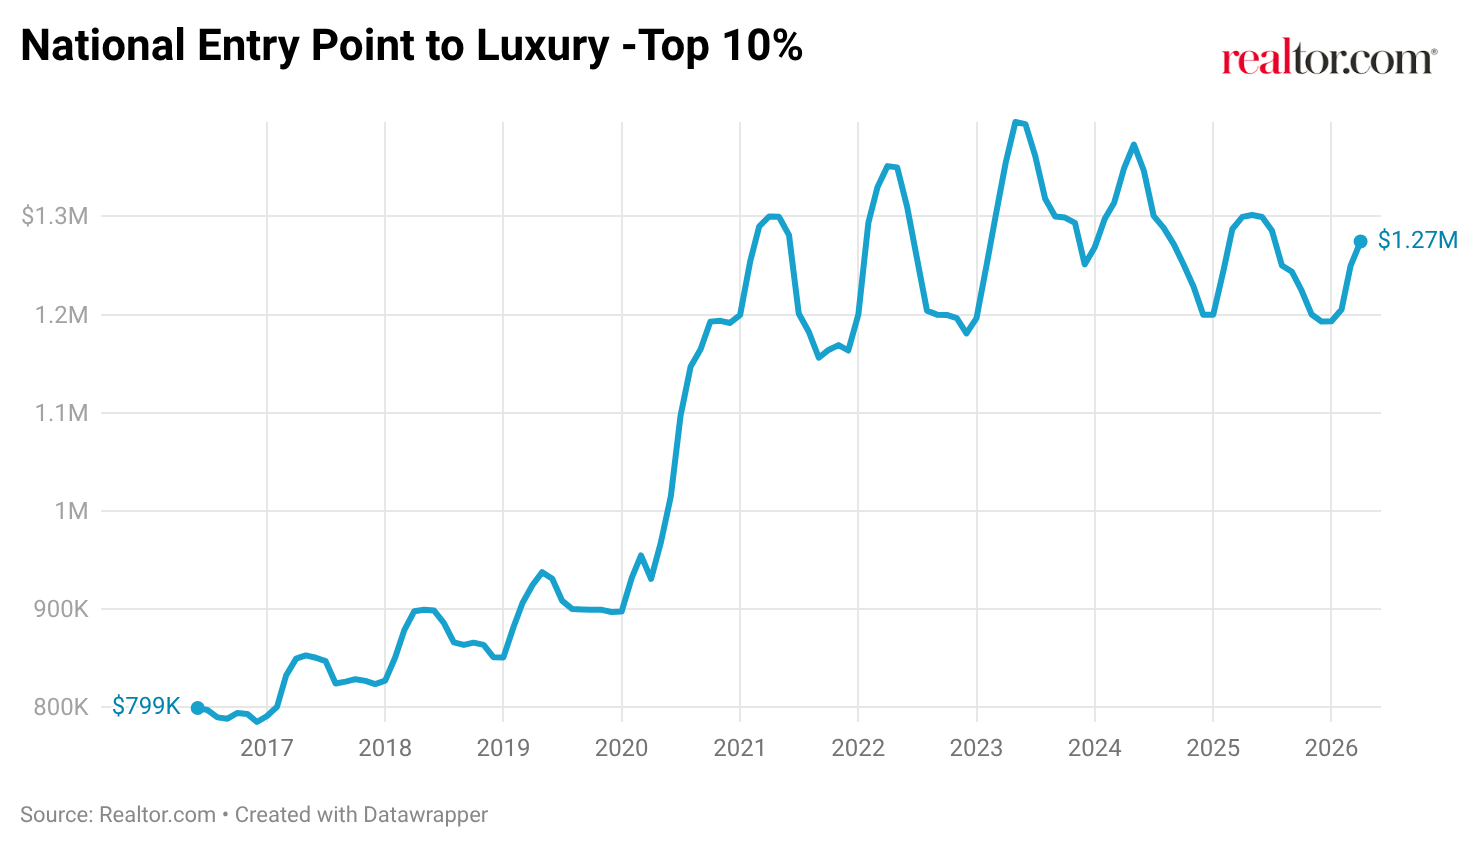
The national entry point for luxury had a seasonal monthly rise in April, increasing 2.0% from March to $1,274,423, though it remains 1.9% below its level a year ago. In fact, this is the 25th consecutive month of year-over-year decline. Notably, declines have pulled back considerably from the peak drops of 5% or more seen in late 2024 and early 2025, suggesting the national level for luxury entry is slowly finding its footing. Overall, the 90th percentile threshold is down 8.7% from the peak reached in May 2023. Each tier of luxury, from entry to ultra, remains below year-ago levels. Although there are monthly gains for both the entry point and high-end luxury, these gains are consistent with the seasonal pattern that has accompanied spring inventory builds in recent years, as more high-end homes enter the market and prices firm seasonally. This is a similar pattern to what is playing out in the broader housing market, where a spring surge in new listings has accompanied a modest seasonal uptick in list prices.
Higher tiers produced a more mixed picture. The 95th-percentile threshold held near $2 million, up slightly (0.3%) from March but down 5.9% from a year ago, pointing to continued recalibration in the high-end segment. Ultraluxury (99th percentile) slipped 1.0% month over month to $5,711,785, remaining 3.7% below April 2025 levels. The million-dollar listing share eased to 13.5%, off 0.4 percentage points from March, reflecting inventory dynamics at the margin rather than any broad retreat in high-end supply. The million-dollar listing share also peaked in May 2023, reaching 15.4%, before declining alongside the 90th-percentile threshold.
Pace of the Luxury Market
| Indicator | April 2026 | Monthly (Days) | YoY (Days) |
| Median Days on Market 90th Percentile | 59 | 3 days faster | 1 day slower |
| Median Days on Market 95th Percentile | 68 | 2 days faster | 2 days slower |
| Median Days on Market 99th Percentile | 86 | 11 days faster | 5 days slower |
| Median Days on Market Median Listing | 52 | 6 days faster | 2 days slower |
Luxury homes are moving slightly more slowly across all tiers than a year ago, a signal that the market is more balanced than the rapid-fire pace seen during the tightest months of the past few years. Entry luxury (90th percentile) came in at 59 days, 1 day slower than April 2025, though homes are moving faster than the winter pace, down 3 days from March, consistent with the seasonal acceleration that typically marks spring.
The 95th and 99th percentile tiers tell a similar story, with all tiers running behind last year’s pace while still improving month over month; the ultraluxury segment saw the most notable seasonal shift, at 11 days faster than March. The national median also followed this pattern, registering at 52 days in April 2026, 2 days slower than in April 2025 and 6 days faster than in March.
Top 10 Most Expensive Metropolitan Luxury Markets
| Rank | Area | 10% Most Expensive Listings Start at: | 10% Most Expensive MoM | 10% Most Expensive YoY | Average Annual Million-Dollar Listings Count | Multiple to National Luxury Median |
| 1 | Bridgeport-Stamford-Danbury, CT | $4,339,500 | 0.5% | -7.6% | 536 | 3.4 |
| 2 | Los Angeles-Long Beach-Anaheim, CA | $4,196,354 | -1.5% | -7.4% | 9,334 | 3.3 |
| 3 | Kahului-Wailuku, HI | $3,999,849 | -4.4% | -4.8% | 715 | 3.1 |
| 4 | Naples-Marco Island, FL | $3,692,278 | 0.6% | 1.9% | 2,294 | 2.9 |
| 5 | San Jose-Sunnyvale-Santa Clara, CA | $3,499,963 | 0.0% | -1.2% | 1,067 | 2.7 |
| 6 | Oxnard-Thousand Oaks-Ventura, CA | $3,385,500 | 11.3% | -3.1% | 662 | 2.7 |
| 7 | Santa Rosa-Petaluma, CA | $3,316,200 | 2.4% | -4.3% | 510 | 2.6 |
| 8 | Crestview-Fort Walton Beach-Destin, FL | $2,996,289 | 2.7% | 2.8% | 1,415 | 2.4 |
| 9 | New York-Newark-Jersey City, NY-NJ | $2,974,531 | -0.8% | -8.3% | 11,523 | 2.3 |
| 10 | San Diego-Chula Vista-Carlsbad, CA | $2,851,750 | -0.7% | -5.4% | 2,354 | 2.2 |
(Among metropolitan areas that averaged at least 500 million-dollar listings over the 12 months through April 2025)
Bridgeport-Stamford-Danbury, CT, returned to the top of the most expensive list in April, with the 90th-percentile threshold reaching $4,339,500, up 0.5% from March. The metro benefits from its deep concentration of Greenwich commuter wealth and coastal enclaves, which consistently anchor its pricing at the upper end nationally. Eight of the ten markets on this month’s list recorded year-over-year price declines, extending the broad softness at the top of the national luxury market.
A few notable exceptions held firm. Naples-Marco Island, FL, posted a 1.9% year-over-year gain, one of the few markets in this tier to move in that direction. Crestview-Fort Walton Beach-Destin, FL, also registered a positive YoY print at +2.8%. Florida markets have also received more attention recently following proposals to eliminate property taxes in the state. New York’s luxury threshold slipped to $2,974,531, down 8.3% from a year ago, though the metro continues to carry one of the deepest million-dollar inventories in the country.
A Closer Look: New York City Reclaims the Lead

In December’s report, we highlighted the crossover between the Miami and New York metropolitan areas in million-dollar listing count, noting that Miami had edged ahead of New York for the first time in a sustained way, driven by structural changes in buyer composition, seasonality patterns, and long-run in-migration trends. That dynamic has shifted in April, with New York’s spring inventory surge pushing its count to 11,580, above Miami’s 10,373.
| Month | Miami Mil-Dollar Count | NYC Mil-Dollar Count | Difference (NYC minus Miami) |
| December 2025 | 10,591 | 10,176 | -415 |
| January 2026 | 10,513 | 9,216 | -1,297 |
| February 2026 | 10,669 | 9,483 | -1,186 |
| March 2026 | 10,532 | 10,311 | -221 |
| April 2026 | 10,373 | 11,580 | 1,207 |
New York’s spring build is a well-established seasonal pattern. Luxury listings in the metro tend to accumulate through April and May as sellers time listings to the peak buyer window, and the spring surge consistently produces the highest annual counts of the year across the months in the NYC metro. Looking back at the full data series, NYC has historically peaked in May or June of each year before declining through the fall and winter.
Miami’s pattern is structurally different, and its trajectory over the past several years tells a more consequential story than any single month comparison. In early 2022, Miami’s million-dollar count stood below 4,000. By April 2025, it had reached 11,595, essentially matching New York’s seasonal peak. That growth reflects a fundamental shift in the metro’s luxury profile: more inventory, a broader buyer base, and a more consistently active market year-round.
Miami’s flatter seasonal curve is one of its defining characteristics at the top end. As noted in the December analysis, luxury buyers in the Miami metro skew more heavily toward cash purchasers, international buyers, and retirees, groups that are less anchored to the school calendar or weather cycles that drive seasonality in markets like New York. The result is a luxury inventory base that holds up better through the winter months, even as New York draws down.
April’s data reflects two markets running on different seasonal rhythms rather than a shift in their underlying trajectories. New York’s spring surge is a feature of how that market functions; Miami moves on its own timeline, similar to many metros across the country that can get overlooked when looking only at national trends. A more precise breakdown of specific market variances can be explored with the Realtor.com Market Clock.
Emerging Luxury Markets
Last month’s report turned the lens toward markets where luxury is the norm, where more than half of all active listings exceed $1 million, and where the median price puts a home near or above the national entry point for luxury. This month, the focus shifts to another side of luxury: markets where luxury may not be dominant, but where the data suggest it is actively gaining ground. Some markets on the list may already have an established luxury identity, but are showing renewed momentum in inventory growth, such as Santa Fe, NM, and the Hilton Head Island-Bluffton-Port Royal, SC metro.
To build this list, we looked at metropolitan areas only, where the average monthly count of million-dollar-plus listings over the past 12 months fell between 200 and 500, the median listing price remained below $1 million, and at least 10% of all active listings were priced at $1 million or above. Markets were then ranked by year-over-year growth in million-dollar-plus listing count. The volume window filters out markets where luxury is too thin to be meaningful, and excludes already-established luxury metros where the segment has long been the dominant story. What remains are markets in active transition: places where luxury has depth, momentum, and, in a few cases, an entry luxury price point below the national level.
| Rank | Area | 10% Most Expensive Listings Start at: | Million-Dollar Listing Count YoY | Share of New Construction (Luxury) | Share of Million-Dollar Listings |
| 0 | USA | $1,274,423 | 0.6% | 18.1% | 13.5% |
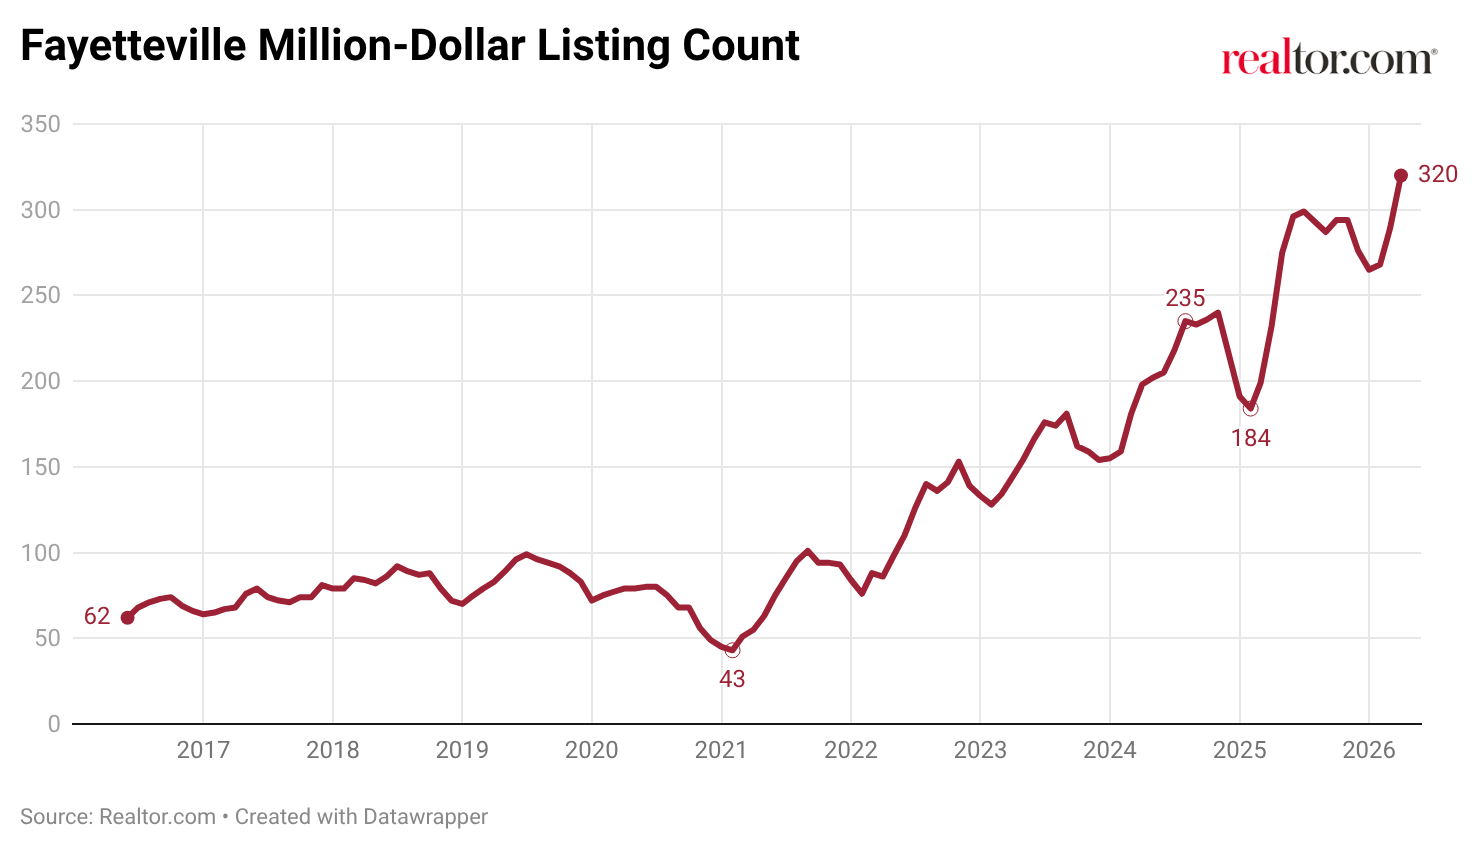
| 1 | Fayetteville-Springdale-Rogers, AR | $1,017,305 | 37.7% | 41.3% | 10.6% |
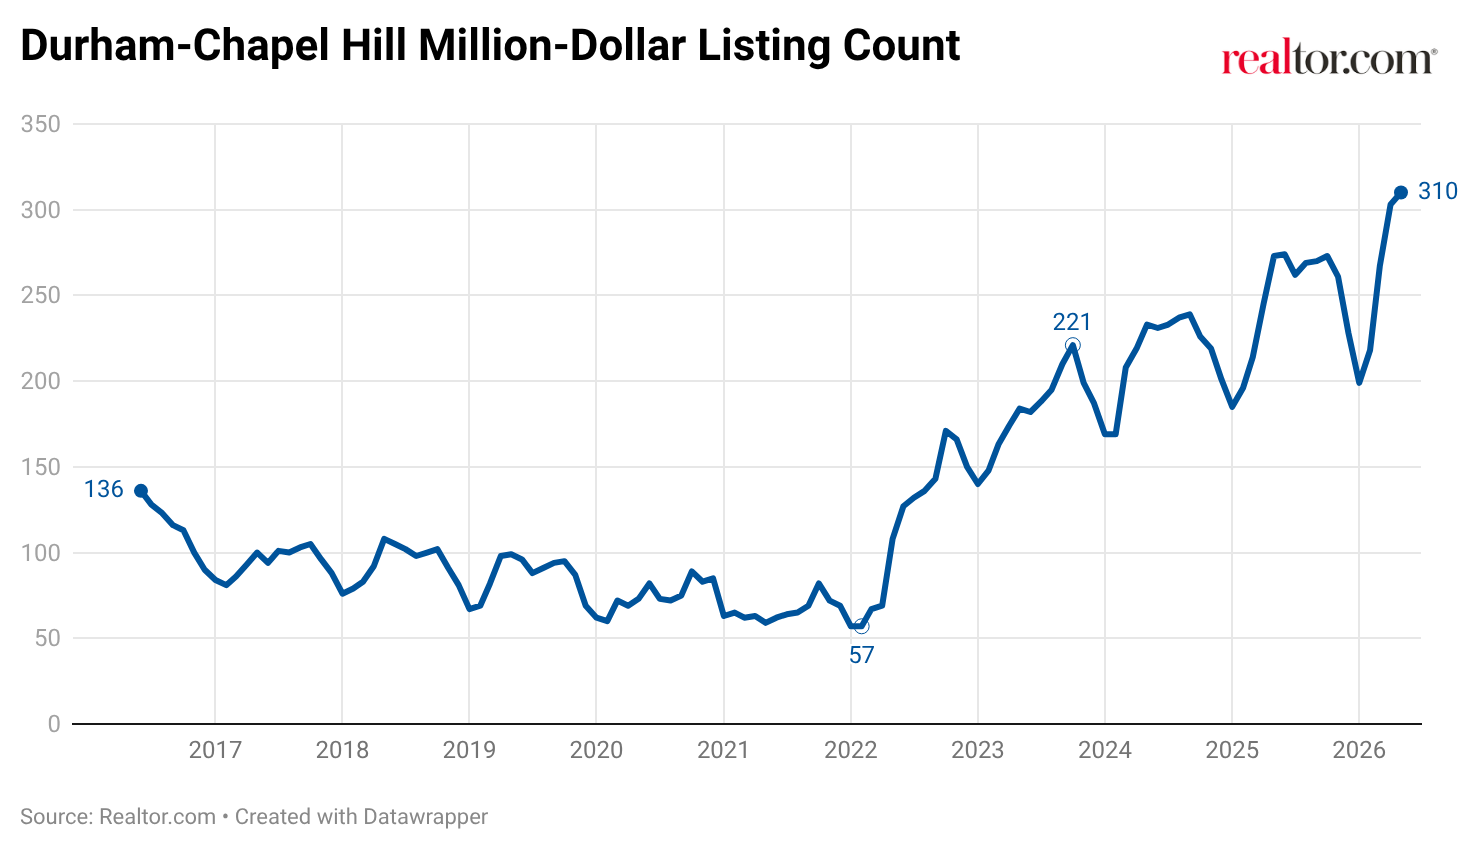
| 2 | Durham-Chapel Hill, NC | $1,239,750 | 23.7% | 30.3% | 16.1% |
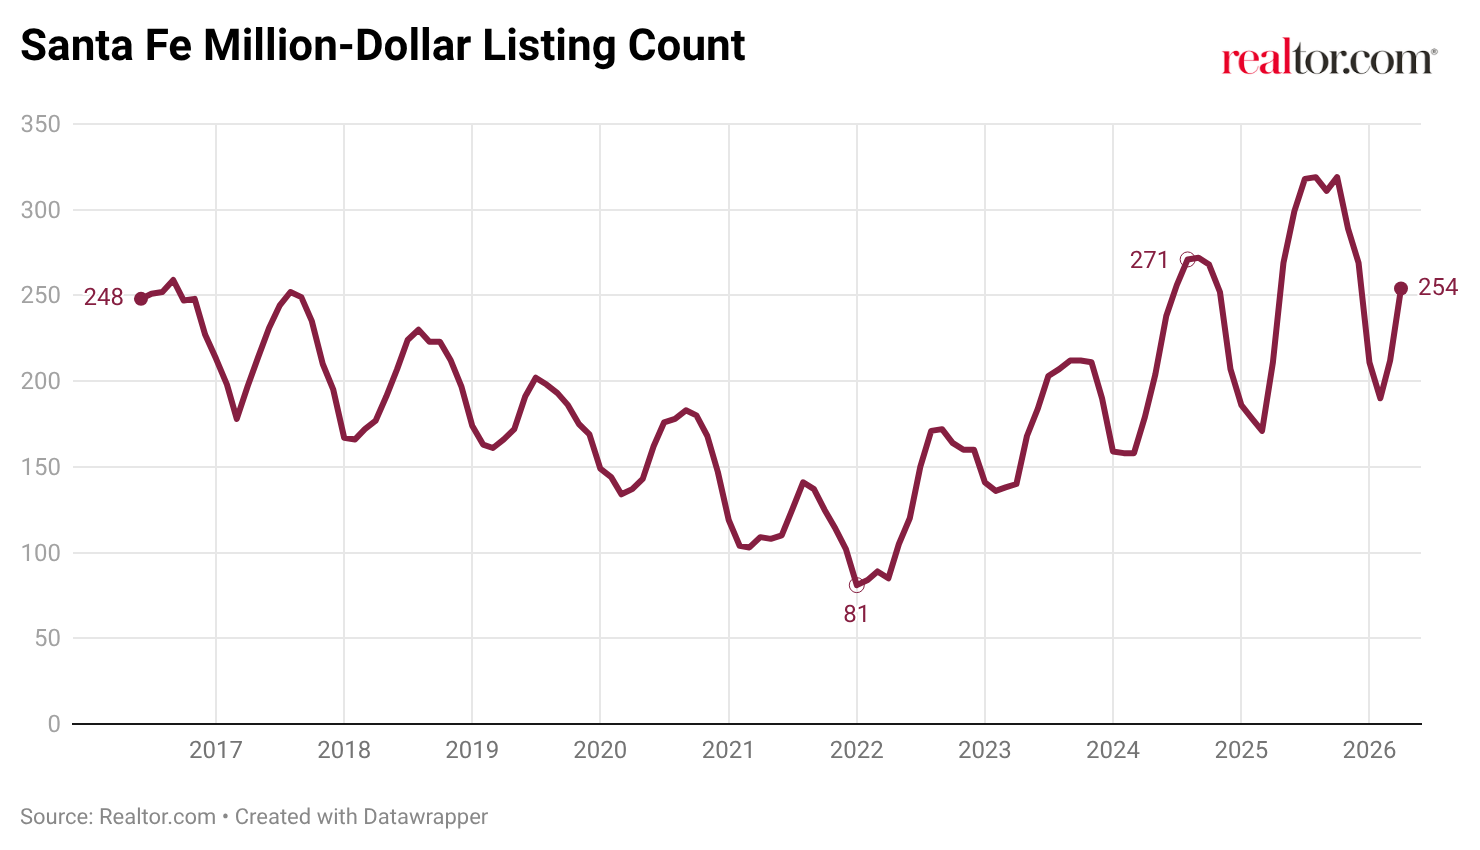
| 3 | Santa Fe, NM | $2,736,250 | 20.7% | 12.4% | 40.3% |
| 4 | Colorado Springs, CO | $1,003,594 | 17.8% | 14.7% | 10.4% |
| 5 | Knoxville, TN | $1,024,042 | 16.0% | 22.2% | 10.3% |
| 6 | Asheville, NC | $1,497,500 | 8.9% | 17.6% | 18.1% |
| 7 | Provo-Orem-Lehi, UT | $1,299,737 | 8.8% | 36.8% | 15.3% |
| 8 | Kiryas Joel-Poughkeepsie-Newburgh, NY | $1,295,000 | 6.7% | 12.9% | 14.3% |
| 9 | St. George, UT | $1,500,000 | 6.4% | 13.1% | 22.0% |
| 10 | Savannah, GA | $1,028,400 | 4.5% | 23.0% | 10.4% |
| 11 | Hilton Head Island-Bluffton-Port Royal, SC | $1,971,050 | 1.0% | 14.3% | 22.5% |
| 12 | Portland-South Portland, ME | $1,649,950 | 0.4% | 14.2% | 21.4% |
(Metropolitan areas where the average monthly million-dollar listing count over the past 12 months was between 200 and 500, the median listing price was below $1,000,000, and at least 10% of active listings were priced at $1 million or above. Ranked by year-over-year growth in million-dollar listing count.)
The new construction share column reveals a notable split across the list. The markets with the fastest-growing luxury counts tend to be the most builder-driven: The Fayetteville metro leads at 41.3%, followed by Provo at 36.8% and Durham-Chapel Hill at 30.3%. In these markets, a meaningful portion of the luxury segment is being actively created through new development rather than drawn from existing stock. The markets lower on the list tell a different story. The Hilton Head, SC metro at 14.3%, Portland, ME at 14.2%, St. George, UT at 13.1%, and Kiryas Joel-Poughkeepsie-Newburgh, NY at 12.9% all post new construction shares well below new construction front-runners, suggesting the luxury depth is more rooted in the appreciation of existing homes, in some cases driven by renovations and upgrades, into the million-dollar tier. Both dynamics can signal emerging luxury momentum, but they point to different underlying drivers.
Fayetteville-Springdale-Rogers, AR: The Fastest-Growing Luxury Market on the List
Fayetteville-Springdale-Rogers leads the emerging list with a 37.7% year-over-year increase in million-dollar listings, averaging 288 such properties over the past 12 months, with 320 active in April. The 90th-percentile entry point of roughly $1.02 million is below the national luxury floor of $1.27 million.
(Entire Fayetteville-Springdale-Rogers Metro Area)
The region’s luxury expansion tracks the broader economic development of Northwest Arkansas. Major corporate headquarters, along with a growing technology and logistics corridor, have steadily elevated the top end of the local market. The share of million-dollar listings sits at 10.6%, up fractionally from a year ago, with momentum concentrated in volume growth rather than price escalation. New construction accounts for 41.3% of luxury listings in the metro, the highest share on the emerging list, reflecting how much of the region’s luxury inventory is purpose-built to meet demand rather than drawn from an existing stock of older homes.
Durham-Chapel Hill, NC: The Research Triangle’s Luxury Ascent
Durham-Chapel Hill posted 23.7% year-over-year growth in million-dollar listings, with 303 active in April against a 12-month average of 258. The metro’s 16.1% luxury share is among the higher readings on this list, a level consistent with a market that has been steadily deepening its luxury inventory for several years rather than experiencing a sudden spike.
(Entire Durham-Chapel Hill Metro Area)
The Research Triangle’s combination of anchor universities, major healthcare and life sciences employers, and continued corporate relocation has created a sustained pipeline of high-income households entering the local market. As covered in our Raleigh vs. Washington D.C. Luxury Showdown, the broader Triangle region has been one of the more compelling luxury growth stories in the Southeast, with buyers finding a market where new construction, established neighborhoods, and institutional employment converge. Durham-Chapel Hill specifically is adding luxury depth through both newer subdivisions and the renovation of older, centrally located properties near the city core. New construction accounts for 30.3% of luxury listings here, reflecting the metro’s ongoing momentum as an emerging luxury market.
Santa Fe, NM: Established Luxury, Renewed Momentum
Santa Fe is a market that warrants a specific note: it appears on this list not as a market in the early stages of luxury development, but as one of the few well-established luxury destinations showing meaningful momentum for million-dollar inventory. The growth in million-dollar inventory in this market doesn’t necessarily indicate waning demand, as listing prices for the top 10% of homes are up 1.8% from last year, outpacing the national trend (-1.9% YoY). With Million-dollar homes accounting for 40.3% of properties and a 90th-percentile entry point of $2.74 million, Santa Fe is clearly a mature luxury market in its own right. It was recently ranked among the top luxury markets nationally in the Wall Street Journal and Realtor.com Spring 2026 Luxury Rankings, where it claimed the top spot.
(Entire Santa Fe Metro)
What makes Santa Fe notable in this context is that its 20.7% year-over-year growth in million-dollar listings is the kind of momentum more commonly seen in markets earlier in their luxury arc. Established luxury markets of this profile typically show steadier, flatter inventory counts. The million-dollar property count has been climbing in Santa Fe since 2022, and the market has historically drawn a more narrow slice of high-net-worth buyers seeking the region’s arts and culture, high-desert landscape, and architectural character. That character is reinforced by the composition of the luxury supply itself: new construction accounts for 12.4% of luxury listings in Santa Fe, suggesting that inventory growth is driven more by existing homes re-entering the market than by new development, a dynamic consistent with a supply-constrained destination.
Close Call: Greenville-Anderson-Greer, SC
One market that narrowly missed the list is Greenville-Anderson-Greer, SC, which posted 30.3% year-over-year growth in million-dollar listings in April, ranking second on the emerging list behind Fayetteville if it qualified. Its million-dollar share sits just below the 10% floor used to build this ranking.
The metro averaged 311 million-dollar listings over the past 12 months, and the 90th-percentile entry point of $973,088 is just below the million-dollar mark, meaning Greenville’s luxury floor is approaching par with the national luxury threshold even as the broader market remains widely accessible at a $389,450 median. New construction accounts for 34.9% of luxury listings, the third highest share among markets that met the full criteria, pointing to active builder investment at the top end. Areas within the metro, such as Sunset, SC (29685), and Six Mile, SC (29682), sit outside the central Greenville area and feature ultraluxury enclaves with waterfront views that rival those of many well-known, established luxury housing markets.
Market Spotlight: Hudson Valley’s Kiryas Joel-Poughkeepsie-Newburgh, NY

Hudson Valley – Tuxedo Park Aerial View
The Kiryas Joel-Poughkeepsie-Newburgh metro is a geographically sprawling area that stretches from Orange County in the south through Dutchess County to the mid-Hudson Valley. Many of the most expensive homes can be found in the quieter, estate-driven communities of the interior and river corridor that have long attracted buyers seeking privacy, land, and a particular kind of Hudson Valley character.
Some of the priciest ZIP codes in the metro come with a variety of offerings that draw luxury home buyers. Pine Plains (12567), with a median of $2,372,500, occupies similar terrain, drawing buyers looking for rural land and historic structures that are increasingly scarce closer to the city. Along with Amenia (12501), which has a handful of large-acreage estates, these communities sit in the rolling farmland of northern Dutchess County, where the luxury market is defined more by land, privacy, and equestrian use than by any single amenity.
Millbrook (12545) and Tuxedo Park (10987) also appear near the top, with medians both sitting just above the $1.2 million mark. Millbrook has long been associated with a more open-country lifestyle and older estates, while Tuxedo Park, an incorporated village and one of the oldest planned communities in the country, offers a more structured form of enclave luxury within the commuting range of New York City.
New construction accounts for 12.9% of luxury listings across the metro, consistent with a market where the appeal is more rooted in existing structures and established land than in new development.
All data in this report is sourced from Realtor.com® listing trends as of April 2026, reflecting active inventory of existing homes, including single-family residences, condos, townhomes, row homes, and co-ops. Listings reflect only those provided by MLS platforms to Realtor.com through a listing feed. New-construction listings are excluded unless actively listed on participating MLSs.
Luxury segmentation is based on market-specific price percentiles, with the 90th percentile representing entry-level luxury, the 95th percentile marking high-end luxury, and the 99th percentile indicating ultraluxury. All calculations are based on listing prices, not final sales prices.
Metropolitan and micropolitan areas are defined using the Office of Management and Budget’s OMB-2023 delineations, with Claritas 2025 household estimates used for relative comparisons. Where appropriate, we limited analysis to metros or micros with a minimum threshold of active million-dollar listings on average over the past year to ensure meaningful comparisons.
Historical listing trend data extends to July 2016, but year-over-year comparisons in this report use March 2025 as the baseline.
Luxury by the Numbers
90th percentile = Entry-level luxury (top 10% of prices)
95th percentile = High-end luxury
99th percentile = Ultraluxury (often rare or custom properties)

