


Market Outlook
April opened under a dark cloud for both the economy in general and the housing market in particular. Gas prices spiked, pushing inflation to 3.3% – nearly a full percentage point growth in just 30 days – consumer sentiment was cratering, and financial markets were in a panic. For housing specifically, mortgage rates had climbed for five straight weeks and hit a seven-month high on April 2nd and mortgage applications were falling. It was seemingly a question of when not if such headwinds would show up in the housing data.
Those headwinds, however, eased slightly throughout the month, especially following the Iran War ceasefire announcement and resulting mortgage rate declines. Realtor.com® data point to a housing market that held its ground in April. The leading indicators that would signal trouble and signs of a second consecutive year of seller pullback in April are, if anything, moving in the right direction. New listings are up (especially in the inventory-constrained Northeast and Midwest), contract cancellations are normal and tracking lower than last year, and price cuts, which can reveal seller panic, are down as well. Volumes too look relatively normal, and the balance of the market continues moving in a more buyer-friendly direction. While it’s too early to be fully certain the spring housing market has weathered the storm, there’s renewed reason for cautious optimism.
In This Report
Q: What were our hopes, expectations, and worries coming into April? How did we do?
A: The worry going into this month was that history would repeat itself. Last spring, tariff-driven uncertainty and recession fears hit in early April, sidelining sellers and buyers and setting up a cruel summer marked by parties too far apart to transact. This year, different triggers (the Iran conflict, spiking gas prices, surging mortgage rates) threatened the same outcome. The hope was that sellers would continue coming to market at the strong March pace, and that buyers would keep engaging despite the volatility. By that measure, April delivered. New listings rose 8.7% month over month and 1.1% year over year— reaching their highest April volume since 2022. Additionally, asking prices continued their decline and price cuts fell rather than spiked.
Q: How has the mortgage rate rollercoaster impacted the market?
A: Rates peaked at 6.46% on April 2nd, then fell three straight weeks to finish below 6.30%. On one hand, that’s still higher than they had been at any point between October 2025 and February 2026. On the other, rates now sit well below where they were the past two Aprils (7.17% in 2024, 6.81% in 2025). After falling in March, mortgage purchase applications rebounded in April as a result. Between that and the continued rise in new listings, it looks as though buyers are relatively unfazed by the volatility. Even so, a resolution to the geopolitical uncertainty in the Middle East would do a world of good for the US consumer and homebuyer.
Q: What should we be monitoring heading into May?
A: Two things. First, whether new listing momentum holds, especially in the Northeast and Midwest where inventory has been tightest. April’s strong gains in those regions are critical, where the market needs existing homeowners to sell and buy to break the high-price, low-inventory lock-in cycle. Second, it’s important to monitor whether lower list prices translate into more pending sales. That’s the proof in the pudding that sellers are pricing to move and buyers are responding. New listings growth has been slightly accelerating while active inventory growth has decelerated. Together, that gap implies more sales and fresher inventory. May’s pending sales data will confirm whether the price correction is working.
April’s Top Storylines, According to the Data
Inventory rose 4.6% year over year, list prices fell for the 6th straight month compared to a year prior, and time on market ticked up. According to the Realtor.com Market Clock, 11 of the nation’s top 50 metros were buyer’s markets heading into Spring, up from 8 in our report a month ago.
Lower list prices and fewer price cuts signals sellers are being more realistic.
Because both median list prices and price cuts fell, sellers appear to be adjusting expectations up front rather than testing the market with higher prices and cutting later.
New listings at highest April levels since 2022, led primarily by sellers in Northeast and Midwest coming off the sidelines.
New listings surged in the Northeast (+ 9.4% YoY, +27.3% MoM) and the Midwest (+6.6% YoY, +16.0% MoM), as sellers in inventory-constrained regions seem to be returning to the market, despite a volatile economic and financial backdrop.
Back to top
Median List Price: $425,000
- Vs. Previous Month: Up 2.3%, a typical seasonal pattern
- Vs. Previous Year: Down 1.4% – the sixth straight month (median list prices, YoY, have been flat or have fallen in each of the past 9 months, going back to Aug 2025)
Price per square foot—a gauge of home values that accounts for the size of homes on the market—moved similarly: +1.1% month over month, -2.4% year over year
At the regional level: Year-over-year median list prices fell in each of the four major regions, running from -3.1% in the West to -0.1% in the Midwest. When adjusting for changing home sizes, median prices per square foot rose more in the Midwest (+1.3), were rather flat in the Northeast (-0.3%) and fell by more in the South (-3.4%) and West (-1.7%).
At the metro level: Median list price per square foot is falling in 35 of the top 50 metros, up from 31 last month. The largest per square foot price declines were in Austin (-7.7%), San Antonio (-5.8%), and Memphis (-5.8%); the largest gains were: Providence (+7.6%), Indianapolis (+5.4%), and Milwaukee (+3.4%).
Active Listings: 1,002,935
- Vs. Previous Month: Up 4.0%
- Vs. Previous Year: Up 4.6%

Year-on-year active listings growth is down from last month (when it was 8.1%). In general, year on year listing growth has been decelerating since last Spring. Nationwide inventory is 12.5% below typical 2017–2019 levels, compared to 13.8% below pre-pandemic norms last month.
At the regional level: Inventory increased across the board, with larger gains in the Midwest (+11.5% YoY) and Northeast (+9.3%), followed by the West (+5.8%) and South (+1.8%).
At the metro level: 39 of the 50 largest markets recorded year-over-year inventory growth. The sharpest increases were seen in Louisville (+33.9%), Indianapolis (+32.4%) and Seattle (+32.3%).
New Listings: 477,116
- Vs. Previous Month: Up 8.7%
- Vs. Previous Year: Up 1.1%

At the regional level: New listings growth was especially strong in the Northeast (+9.4% YoY, +28% MoM) and Midwest (+6.6% YoY, +19% MoM)), and muted in the South (+0.6% YoY, +1.4% MoM) and West (-3.5% YoY, +4% MoM).
The new listings rebound was especially pronounced when comparing to last month’s YoY numbers in the Northeast and Midwest (where new listings were down 1.2% and 1.3% YoY, respectively in March 2026).
At the metro level: Metros with the strongest new listing growth year over year were Virginia Beach (+23.8% YoY), Indianapolis (+21.1%), and Louisville (+19.2%).
Time on the Market: 52 Days
- Vs. Previous Year: +2 days slower

This marks the 25th straight month of homes taking longer to sell on a year-over-year basis. The median home has spent 3 fewer days on market than the pre-pandemic norm.
Regional and metro levels: Time on market was up modestly across most major regions (Northeast -1 day; Midwest +3; South +3; West +4) and grew in 40 of the top 50 metros (up from 35 last month).
Pending Sales (Contract Activity)
- Vs. Previous Year: Up 1.0%, the fourth straight month of year-over-year growth
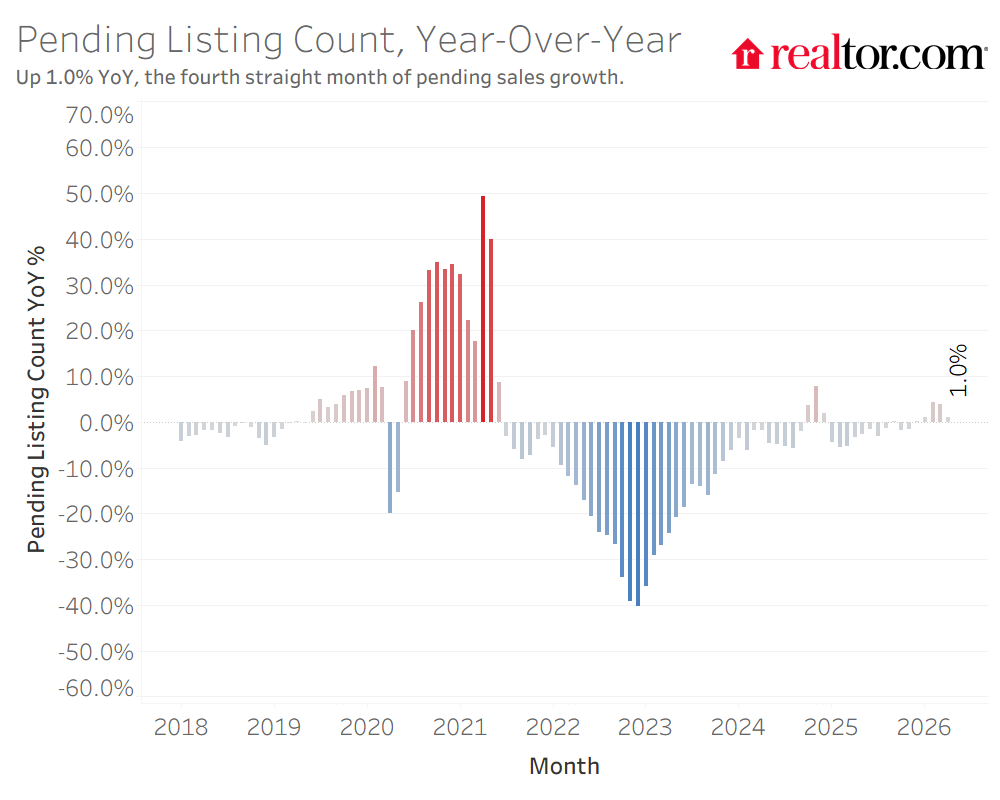
We have not seen four straight months of year-over-year pending sales growth since March through June 2021.
Price Cuts: 16.7% of listings saw a price cut in April
- Vs. Previous Year: Down 1.2 percentage points

Compared to last year, 2026 has seen both fewer price cuts and lower median list prices, suggesting sellers have internalized the generally more buyer-friendly market conditions and are adjusting price expectations before rather than after listing. This is consistent with survey findings showing that sellers expect to make more concessions even as they expect to be more likely to get their asking price.
Regional and metro levels: Price cuts remain less common in the Northeast (10.2% of listings) and Midwest (13.4%) compared to the South (18.8%) and West (17.9%).
Back to top
National
| Metric | April 2026 | Change over March 2026 (MoM) | Change over Apr. 2025 (YoY) | Change over Apr. 2019 | Change over Apr. 2022 |
| Median listing price | $425,000 | 2.3% | -1.4% | 34.9% | 1.3% |
| Active listings | 1,002,935 | 4.0% | 4.6% | -11.8% | 163.9% |
| New listings | 477,116 | 8.7% | 1.1% | -13.6% | -3.7% |
| Median days on market | 51.5 | -5.5 | 2 | -2 | 22 |
| Share of active listings with price reductions | 16.7% | 0.5 | -1.2 | 2.3 | 9.9 |
| Median List Price Per Sq.Ft. | $227 | 1.1% | -2.4% | 50.3% | 3.8% |
Regional: Listings
| Active Listings | New Listings | ||||||
| Apr. 2026 | YoY | vs. Pre-Pandemic | Apr. 2026 | YoY | vs. Pre-Pandemic | ||
| USA Avg. | 1,002,935 | 4.6% | -12.5% | 477,116 | 1.1% | -13.8% | |
| Northeast | 93,796 | 9.3% | -51.6% | 64,796 | 9.4% | -26.9% | |
| Midwest | 135,548 | 11.5% | -37.5% | 93,188 | 6.6% | -19.9% | |
| South | 562,164 | 1.8% | 3.1% | 217,280 | 0.6% | -3.5% | |
| West | 208,449 | 5.8% | 10.8% | 100,244 | -3.5% | -19.9% | |
Regional: Prices
| Median List Price | Median List Price Per Sq. Ft. | ||||||
| Apr. 2026 | YoY | vs. Pre-Pandemic | Apr. 2026 | YoY | vs. Pre-Pandemic | ||
| USA Avg. | $425,000 | -1.4% | 44.9% | $227 | -2.4% | 60.5% | |
| Northeast | $537,450 | -2.3% | 64.2% | $310 | -0.3% | 84.3% | |
| Midwest | $319,450 | -0.1% | 48.5% | $181 | 1.3% | 61.6% | |
| South | $386,500 | -2.6% | 39.1% | $207 | -3.4% | 56.4% | |
| West | $599,450 | -3.1% | 42.0% | $322 | -1.7% | 59.4% | |
Regional: Market Pressures
| Median Time on Market | Share of Listings with Price Cuts | ||||||
| Apr. 2026 | YoY | vs. Pre-Pandemic | Apr. 2026 | YoY | vs. Pre-Pandemic | ||
| USA Avg. | 52 | 2 | -4 | 16.7% | -1.2% | 1.4 | |
| Northeast | 40 | -1 | -19 | 10.2% | 0.4% | -3.2 | |
| Midwest | 43 | 3 | -8 | 13.4% | 0.6% | -1.0 | |
| South | 58 | 3 | -2 | 18.8% | -1.8% | 2.2 | |
| West | 50 | 4 | 6 | 17.9% | -1.1% | 3.6 | |
Back to top
April 2026 National and Regional Housing Overview
| Region | Active Listing Count, YoY | New Listing Count, YoY | Median List Price | Median List Price, YoY | Median List Price Per SF, YoY | Median Days on Market, YoY (Days) | Price-Reduced Share | Price-Reduced Share, YoY (Percentage Points) |
| Northeast | 9.3% | 9.4% | $537,450 | -2.3% | -0.3% | -1 | 10.2% | 0.4 |
| Midwest | 11.5% | 6.6% | $319,450 | -0.1% | 1.3% | 3 | 13.4% | 0.6 |
| South | 1.8% | 0.6% | $386,500 | -2.6% | -3.4% | 3 | 18.8% | -1.8 |
| West | 5.8% | -3.5% | $599,450 | -3.1% | -1.7% | 4 | 17.9% | -1.1 |
| National Average | 4.6% | 1.1% | $425,000 | -1.4% | -2.4% | 2 | 16.7% | -1.2 |
April 2026 Housing Overview of the 50 Largest Metros
| Metro | Active Listing Count YoY | New Listing Count, YoY | Median List Price | Median List Price, YoY | Median List Price Per SF, YoY | Median Days on Market, YoY (Days) | Price-Reduced Share | Price-Reduced Share, YoY (Percentage Points) |
| Atlanta-Sandy Springs-Roswell, GA | 4.3% | -4.1% | $422,400 | 2.4% | -0.2% | 3 | 19.5% | -1.4 |
| Austin-Round Rock-San Marcos, TX | -0.2% | -13.5% | $475,000 | -9.5% | -7.7% | 7 | 23.6% | -2.3 |
| Baltimore-Columbia-Towson, MD | 11.3% | 3.6% | $380,500 | -3.1% | -0.8% | 3 | 14.9% | 1.5 |
| Birmingham, AL | 7.5% | 2.5% | $299,650 | -0.1% | 0.8% | 2 | 16.3% | 0.2 |
| Boston-Cambridge-Newton, MA-NH | 13.9% | -3.8% | $832,500 | -5.2% | 0.3% | 0 | 12.0% | -0.1 |
| Buffalo-Cheektowaga, NY | 20.5% | -0.4% | $264,750 | -5.4% | 0.4% | 2 | 5.4% | -1.1 |
| Charlotte-Concord-Gastonia, NC-SC | 20.4% | 6.2% | $429,950 | -2.2% | -1.8% | 3 | 21.0% | -0.1 |
| Chicago-Naperville-Elgin, IL-IN | -2.6% | -5.2% | $375,000 | 0.7% | 0.9% | 1 | 10.1% | -0.4 |
| Cincinnati, OH-KY-IN | 26.5% | 13.7% | $347,635 | 0.0% | -0.3% | 3 | 14.8% | 1.7 |
| Cleveland, OH | 9.2% | 7.8% | $262,225 | -2.0% | 1.9% | 1.5 | 13.4% | 0.4 |
| Columbus, OH | 12.7% | 18.0% | $372,400 | -1.3% | -1.5% | 4.5 | 17.2% | -1.6 |
| Dallas-Fort Worth-Arlington, TX | 0.1% | -5.9% | $430,000 | 0.0% | -1.8% | 2.5 | 22.1% | -3.7 |
| Denver-Aurora-Centennial, CO | 0.5% | -12.6% | $587,000 | -2.1% | -3.2% | 3.5 | 24.3% | -2.8 |
| Detroit-Warren-Dearborn, MI | 20.0% | 6.7% | $248,900 | -1.8% | 0.5% | 2.5 | 13.5% | 0.9 |
| Hartford-West Hartford-East Hartford, CT | -6.9% | -4.2% | $464,900 | 2.5% | -1.4% | -5 | 6.2% | -0.4 |
| Houston-Pasadena-The Woodlands, TX | 6.9% | -3.5% | $359,897 | -2.7% | -2.3% | 4.5 | 18.2% | -1.0 |
| Indianapolis-Carmel-Greenwood, IN | 32.4% | 21.1% | $318,400 | -3.3% | 5.4% | 0.5 | 19.9% | 0.1 |
| Jacksonville, FL | -21.3% | -8.1% | $395,000 | -1.2% | -2.4% | 1 | 22.6% | -5.1 |
| Kansas City, MO-KS | 26.1% | -2.5% | $412,485 | 3.3% | 0.3% | -6 | 11.1% | -1.5 |
| Las Vegas-Henderson-North Las Vegas, NV | 12.1% | -8.8% | $474,950 | 0.0% | -2.2% | 7.5 | 21.6% | 0.3 |
| Los Angeles-Long Beach-Anaheim, CA | 6.8% | -3.3% | $1,098,500 | -8.1% | -3.3% | 2 | 13.2% | -1.1 |
| Louisville/Jefferson County, KY-IN | 33.9% | 19.2% | $311,443 | -4.2% | 0.8% | -0.5 | 17.7% | 3.0 |
| Memphis, TN-MS-AR | 16.4% | 9.9% | $300,995 | -12.9% | -5.8% | -2 | 22.3% | 1.6 |
| Miami-Fort Lauderdale-West Palm Beach, FL | -12.9% | -7.2% | $499,250 | -2.1% | -1.6% | 5 | 15.7% | -4.4 |
| Milwaukee-Waukesha, WI | 18.3% | 14.3% | $392,500 | 1.9% | 3.4% | 6.5 | 9.4% | 0.7 |
| Minneapolis-St. Paul-Bloomington, MN-WI | 16.5% | 10.7% | $432,500 | -3.3% | -0.9% | 0.5 | 12.2% | 1.6 |
| Nashville-Davidson–Murfreesboro–Franklin, TN | 15.7% | 7.3% | $538,901 | -1.9% | -1.2% | 3 | 18.7% | -0.1 |
| New York-Newark-Jersey City, NY-NJ | 6.2% | 11.4% | $772,929 | -2.1% | -1.3% | -4 | 8.3% | 0.6 |
| Oklahoma City, OK | 7.9% | 6.5% | $319,598 | -0.8% | -0.7% | 8.5 | 19.1% | 0.7 |
| Orlando-Kissimmee-Sanford, FL | -4.0% | -9.0% | $419,000 | -1.4% | -3.3% | 6 | 20.8% | -2.6 |
| Philadelphia-Camden-Wilmington, PA-NJ-DE-MD | 11.2% | 9.9% | $372,450 | -0.7% | 0.0% | 0.5 | 13.0% | 0.5 |
| Phoenix-Mesa-Chandler, AZ | -0.2% | -4.9% | $499,000 | -5.0% | -1.7% | 5 | 29.1% | -2.2 |
| Pittsburgh, PA | 9.7% | 10.5% | $248,625 | 2.0% | 2.7% | 3.5 | 14.6% | -1.1 |
| Portland-Vancouver-Hillsboro, OR-WA | 7.2% | -6.1% | $579,750 | -5.7% | -2.7% | 2.5 | 24.0% | 0.7 |
| Providence-Warwick, RI-MA | 7.7% | 3.8% | $577,475 | -1.3% | 7.5% | -2.5 | 8.0% | -0.1 |
| Raleigh-Cary, NC | 9.9% | 3.6% | $449,950 | -0.3% | -2.0% | 1 | 19.0% | -1.1 |
| Richmond, VA | 4.7% | 6.3% | $449,975 | -2.0% | 2.2% | 1.5 | 10.5% | 0.6 |
| Riverside-San Bernardino-Ontario, CA | -0.4% | -5.6% | $596,500 | -1.0% | -2.3% | 2.5 | 16.0% | -2.4 |
| Sacramento-Roseville-Folsom, CA | 2.6% | -5.7% | $628,520 | -0.8% | -0.2% | 0.5 | 16.6% | -1.3 |
| Salt Lake City-Murray, UT | 4.8% | 2.5% | $552,450 | -3.9% | -0.1% | 0.5 | 20.9% | -3.1 |
| San Antonio-New Braunfels, TX | 9.5% | 7.3% | $324,700 | -4.5% | -5.8% | -4.5 | 24.9% | -0.7 |
| San Diego-Chula Vista-Carlsbad, CA | -0.1% | -5.5% | $933,325 | -4.7% | -4.1% | 1 | 14.9% | -2.9 |
| San Francisco-Oakland-Fremont, CA | -12.9% | -1.5% | $998,400 | 0.3% | -3.0% | -2 | 11.4% | -2.0 |
| San Jose-Sunnyvale-Santa Clara, CA | 8.6% | 0.9% | $1,398,500 | -0.1% | -2.5% | 3.5 | 13.1% | 1.1 |
| Seattle-Tacoma-Bellevue, WA | 32.3% | 2.4% | $776,232 | -0.8% | -3.0% | 4 | 16.2% | 1.8 |
| St. Louis, MO-IL | 14.8% | 4.6% | $285,738 | -3.1% | 1.1% | 3.5 | 13.8% | 0.4 |
| Tampa-St. Petersburg-Clearwater, FL | -7.0% | -15.7% | $406,500 | -0.9% | -2.8% | 9.5 | 25.1% | -4.2 |
| Tucson, AZ | 2.1% | -13.9% | $386,000 | -2.6% | -2.0% | 7 | 23.4% | -0.1 |
| Virginia Beach-Chesapeake-Norfolk, VA-NC | 4.0% | 23.8% | $425,000 | 3.7% | 2.2% | -0.5 | 15.6% | -0.4 |
| Washington-Arlington-Alexandria, DC-VA-MD-WV | 11.2% | 4.9% | $584,995 | -6.1% | -3.6% | 4 | 12.8% | -0.9 |
Methodology
Realtor.com housing data as of April 2026. Listings include the active inventory of existing single-family homes and condos/townhomes/row homes/co-ops for the given level of geography on Realtor.com. New construction is excluded unless listed on an MLS that provides listing data to Realtor.com. Realtor.com data history goes back to July 2016. The 50 largest U.S. metropolitan areas as defined by the Office of Management and Budget (OMB-202301) and Claritas 2025 estimates of household counts.
Beginning with our April 2025 report, we have transitioned to a revised national pending home sales data series that applies enhanced cleaning methods to improve consistency and accuracy over time. While the insights and commentary in this report reflect the new series, the downloadable data remains based on our legacy automated pipeline. As a result, there may be slight differences between the report figures and those in the national download file as we transition.
With the release of its January 2025 housing trends report, Realtor.com has restated data points for some previous months. As a result of these changes, some of the data released since January 2025 will not be directly comparable with previous data releases (files downloaded before January 2025) and Realtor.com economics research reports.
Methodology for cancellations: A contract cancellation is counted if a listing was pending on one day and then back to active the next. It may miss a few that have been entirely delisted.

