


Key takeaways
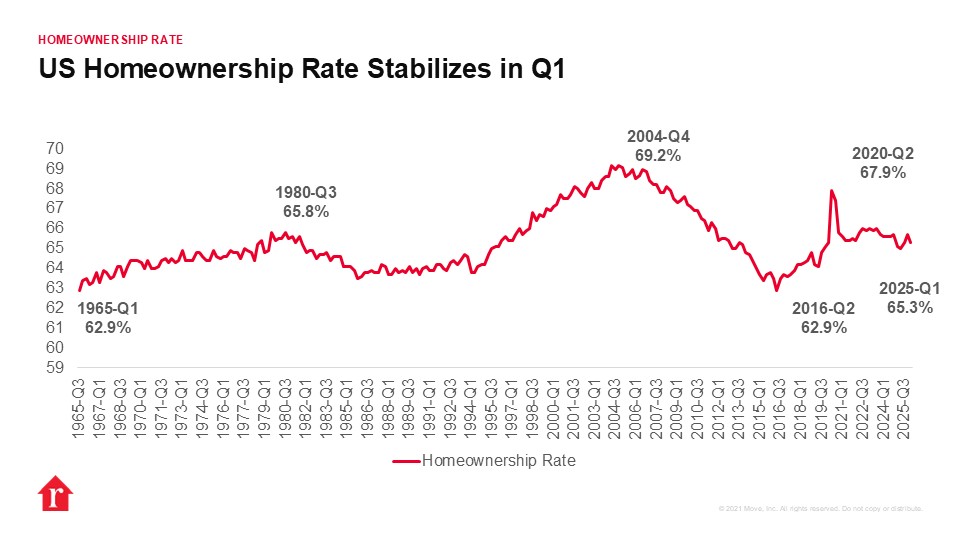
- Homeownership remains range-bound. The U.S. homeownership rate held at 65.3% in Q1 2026, statistically unchanged from both the prior quarter and a year earlier. The rate continues to plateau in a narrow mid-65% band, with affordability pressures and limited supply showing little sign of easing their grip on the market.
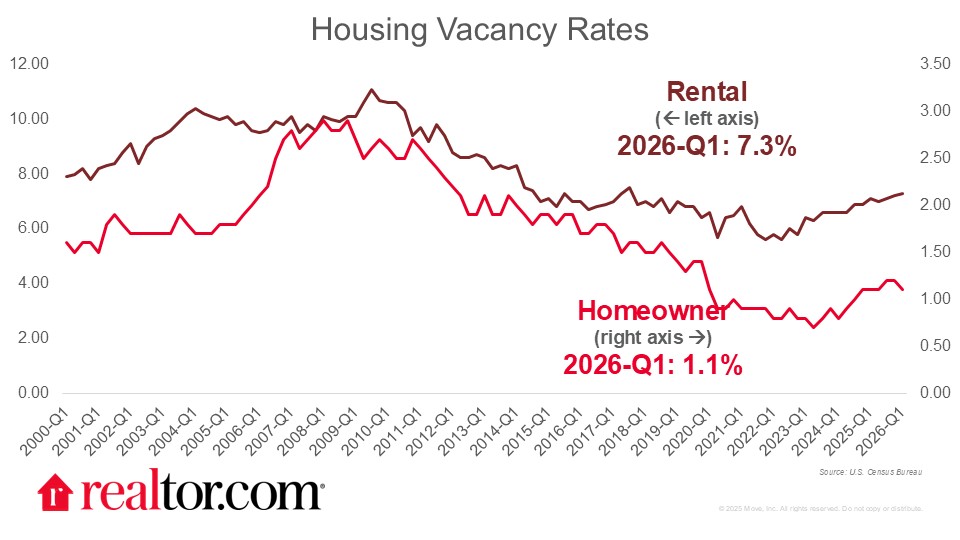
- Vacancy rates are stabilizing after a gradual recovery. The homeowner vacancy rate dipped to 1.1% in Q1, while the rental vacancy rate edged up to 7.3%, both statistically unchanged from recent quarters. The modest inventory recovery that characterized much of 2025 appears to be leveling off rather than accelerating.
- Renting remains a critical pressure valve, though conditions vary by geography. With a national rental vacancy rate of 7.3%, rental markets continue to offer more flexibility for households unable to buy. However, conditions are uneven: Principal cities (7.8%) remain looser than suburbs (7.1%), while nonmetro areas (5.4%) tightened meaningfully year over year.
- The South is driving supply growth—and vacancy. The South posted the highest rental vacancy rate (9.3%) and homeowner vacancy rate (1.6%) of any region, with both rising year over year.
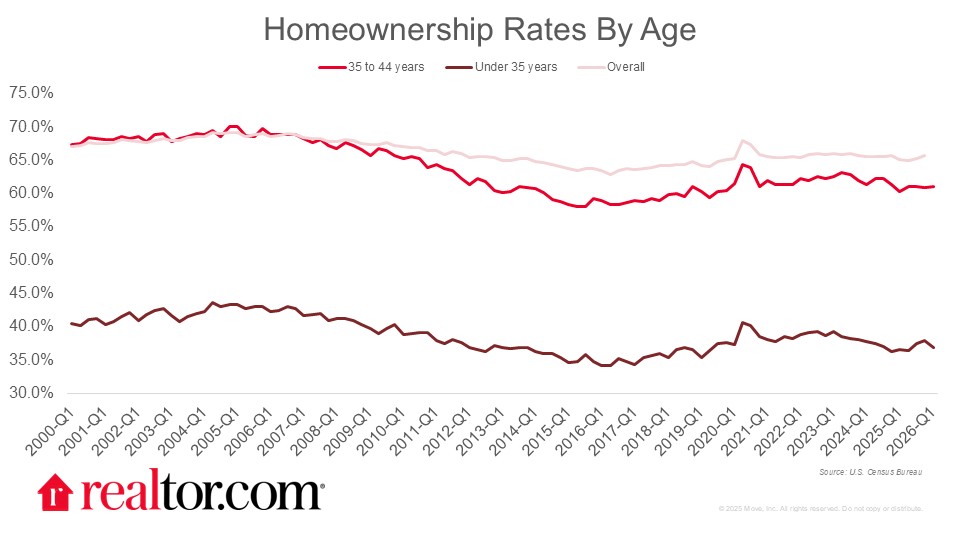
- Middle-aged households are facing growing headwinds. Homeownership among those aged 45 to 54 was the only age group to post a statistically significant year-over-year decline, falling to 69.2%. All other age cohorts held steady, including younger households under 35, who remained at 36.8%.
- Racial ownership gaps remain entrenched. Homeownership rates shifted modestly across groups in Q1, with non-Hispanic White householders edging up to 75.0% while rates for Asian, Native Hawaiian, and Pacific Islander householders and all other racial groups declined. Black householders held at 44.0% and Hispanic householders at 48.2%, leaving the gap between the highest and lowest groups at nearly 31 percentage points.
What happened this quarter
The U.S. homeownership rate edged down to 65.3% in the first quarter of 2026, holding steady compared with both the prior quarter and a year earlier. While the rate remains within the narrow mid-65% range that has characterized the market in recent years, it continues to sit well below the pandemic-era highs seen in 2020. Ongoing affordability pressures and a limited supply of reasonably priced homes continue to cap ownership gains.
The homeowner vacancy rate dipped to 1.1% in Q1 2026, unchanged from a year earlier and not statistically different from the fourth quarter of 2025. While homeowner vacancy remains below pre-pandemic norms, the modest upward drift seen through 2025 appears to have stabilized, suggesting inventory recovery may be leveling off in the near term.
The rental vacancy rate rose to 7.3% in the first quarter, statistically unchanged from both the prior quarter (7.2%) and a year earlier (7.1%). Renting continues to serve as a comparatively accessible alternative for households unable to purchase a home. Vacancy was highest in principal cities (7.8%), followed by the suburbs (7.1%), while nonmetro areas posted a lower rate of 5.4%, the only geography to show a statistically significant year-over-year decline.
Regional differences remain pronounced. The South recorded the highest rental vacancy rate at 9.3%, and was one of two regions, along with the Northeast (5.9%), to post a statistically significant year-over-year increase. The Midwest (6.5%) saw rental vacancy decline from a year ago, while the West (5.8%) was unchanged. On the ownership side, the South again led with the highest homeowner vacancy rate at 1.6%, the only region to show a significant annual increase. The Midwest continues to stand out for its high homeownership rate, reaching 70.1% in Q1 2026, well above the South (66.9%), Northeast (61.5%), and West (60.7%), and posting the only statistically significant year-over-year gain in homeownership of any region.
Different outcomes by race/ethnicity
Homeownership rates by race and ethnicity were mixed year over year. In the first quarter, the rate for non-Hispanic White householders edged up year over year to 75.0%, while rates declined for Asian, Native Hawaiian, and Pacific Islander householders to 60.1% and for all other racial groups to 55.8%. The rate for Black householders held relatively steady at 44.0% and for Hispanic householders at 48.2%, with neither showing a statistically significant change from a year ago. The gap between the highest and lowest rates remains nearly 31 percentage points, underscoring the persistence of structural barriers to ownership.
Different outcomes by age
By age, the picture was largely stable with one notable exception. Homeownership among those aged 45 to 54 declined year over year to 69.2%, the only age group to show a statistically significant change. Rates held steady across all other cohorts, including those under 35, who remained at 36.8%. Homeownership among households 65 and older remained the highest of any age group at 78.4%, though modestly below recent readings.

