


Key takeaways
- Rising popularity: Multigenerational households now comprise 4.5% of owner-occupied homes, typically featuring larger footprints and higher median incomes ($131,000) due to more people per household.
- Price premium: Nationally, these homes list for 65% more than standard listings (22% more per square foot), driven by specialized features and coastal concentration.
- Strong demand: Despite the higher price, these listings attract 13.5% more page views and sell as quickly as standard properties, showing that demand is keeping pace with supply.
- Regional contrast: California markets feature high supply and price normalization, whereas in the Midwest and South, scarcity drives extreme price premiums and intense buyer interest.
This Mother’s Day, nearly 3 million owner-occupied homes across America have at least two mothers living under one roof, sharing the joys and responsibilities of raising the next generation together. That sense of shared purpose and care is at the heart of multigenerational living, a housing arrangement that is quietly shaping American family life.
Multigenerational household trends
In 2024, 4.5% of owner-occupied households, nearly 4 million, were multigenerational. (This is defined as those containing three or more generations.) The share of multigenerational households was up slightly from 4.3% in both 2014 and 2019 as the count grew by 0.7 million from 2014. While the share held steady for much of the past decade, the pace of growth appears to be picking up, suggesting that multigenerational living is becoming an increasingly common choice for American families as high housing and childcare costs create strong reasons for co-living. The typical multigenerational household has five people sharing a four-bedroom home, with a median annual household income of $131,000. Among owner-occupied multigenerational households, 44.9% are White, 25.8% are Hispanic, 13.5% are Black, 11.1% are Asian, 3.9% are another race, and 0.9% are American Indian or Pacific Islander.
Among the 100 largest metros, Urban Honolulu, HI (12.1%), sees the highest share of multigenerational households, followed by Riverside, CA (10.9%), Stockton, CA (10.1%), McAllen, TX (10.1%), and Bakersfield, CA (8.8%). In fact, over the past 10 years, Bakersfield saw the fastest growth in share of multigenerational households, followed by Riverside, Stockton, Spokane, WA, and Little Rock, AR. While multigenerational households are more clustered in the West, a higher share of them are also seen along the East Coast, in cities such as Lakeland, FL (6.7%), Miami, FL (6.4%), and New York, NY (6.3%).
Multigenerational listing trends
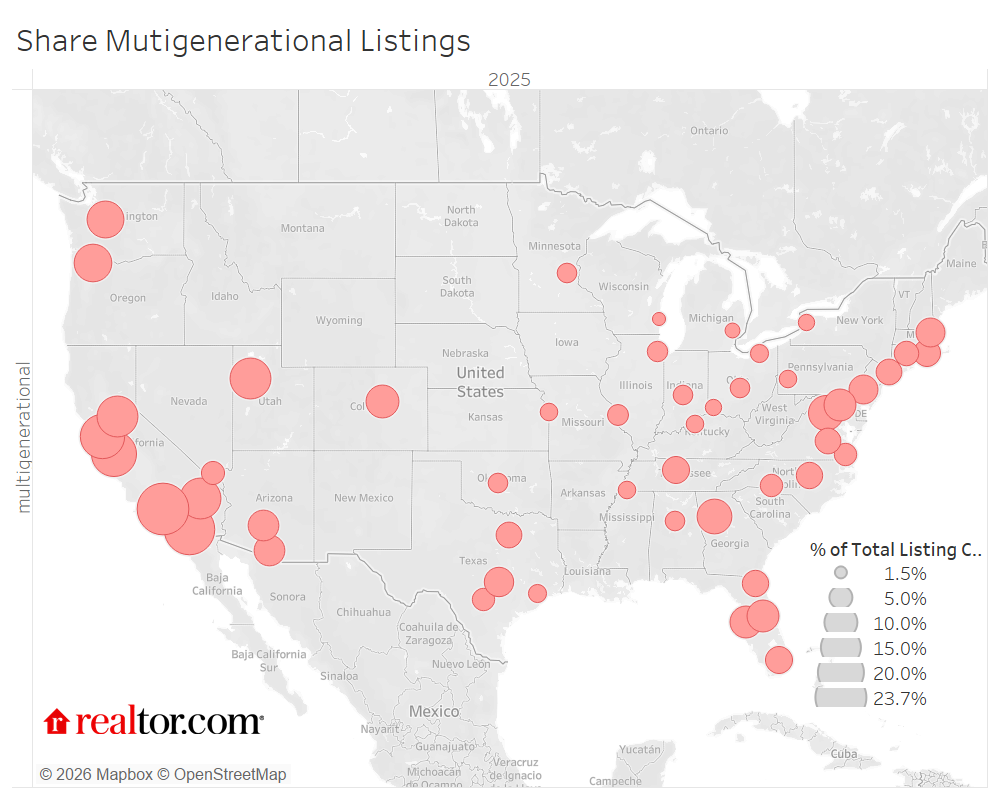
While U.S. Census Bureau data reveals who is living in these homes today, our analysis of 2025 active listing data on Realtor.com® highlights the supply and demand dynamics shaping where these families will live tomorrow. Multigenerational homes, whose descriptions include keywords such as “guest house” or “granny-flat,” represented about 6.1% of all active listings nationally in 2025. However, that modest headline figure masks enormous geographic variation and a striking affordability premium. Nationally, the median list price for a multigenerational home was $709,000 in 2025, roughly 65% higher than the $429,900 median for standard listings, a premium that partly reflects their typically larger square footage.
| Metro | Multigenerational Price / Sq. Ft. premium |
| United States | 21.9% |
| St. Louis, MO-IL | 28.5% |
| Austin-Round Rock-San Marcos, TX | 21.8% |
| Detroit-Warren-Dearborn, MI | 20.9% |
| San Antonio-New Braunfels, TX | 19.9% |
| Nashville-Davidson–Murfreesboro–Franklin, TN | 12.3% |
| Jacksonville, FL | 11.6% |
| Cleveland, OH | 11.0% |
| Miami-Fort Lauderdale-West Palm Beach, FL | 10.9% |
| Pittsburgh, PA | 10.8% |
| Dallas-Fort Worth-Arlington, TX | 9.9% |
On a per-square-foot basis, multigenerational homes command about $262 versus $215 for standard homes, a 22% premium that reflects the concentration in the high-cost West region and often distinct structural features (in-law suites, secondary kitchens, dual entries) that define the category. Looking instead at the price-per-square-foot difference at the metro level, the 10 metros with the highest concentration of multigenerational homes actually see these homes priced about 1% lower than the standard home, likely due to their location within the metro.
Despite the higher overall listing price tags, these homes are drawing notably more attention from buyers: The median multigenerational listing receives about 13.5% more page views than the typical standard listing, and they sell in essentially the same time frame with a median of 59 days on the market for both types, suggesting demand is keeping pace with the higher price points.
The West Coast dominates supply and share
The regional story is starkly uneven, with the Western U.S., particularly California, accounting for the highest concentrations of multigenerational listings by a wide margin. Western metros average around 14% multigenerational share, compared to 6.1% in the South, 5.3% in the Northeast, and 2.9% in the Midwest. The top five metros by multigenerational share are all California markets: Los Angeles leads at 23.7%, followed by San Diego (22.7%), San Jose (18.0%), San Francisco (17.4%), and Riverside (14.9%). California’s outsized representation likely reflects a confluence of factors: a large multigenerational cultural tradition among its significant Asian and Hispanic populations, extreme baseline housing costs that make shared living economically necessary, and a more established housing stock purpose-built or adapted for extended families. Notably, California metros also show relatively modest price premiums between multigenerational and standard listings, just 1.6% in L.A. and 8.4% in San Francisco, suggesting multigenerational homes are more normalized and widely distributed across price tiers there.
The Midwest and South: High demand and high premiums for multigenerational properties
The most compelling demand story emerges in markets where multigenerational inventory is thin, particularly Midwestern and some Southern metros. Detroit, Cleveland, and Buffalo sit near the bottom for multigenerational share of listings (2.0%, 3.1%, and 2.5%, respectively). Yet these markets show median listing price price premiums of 120%, 107%, and 94% for multigenerational homes over standard listings, the highest in the dataset. Detroit multigenerational listings also garner 82% more page views than standard homes, with Cleveland close behind at 78%. This pattern suggests that in lower-cost, inventory-constrained markets, multigenerational homes are a rare commodity attracting intense buyer interest when they do appear. Similarly, markets such as Oklahoma City, San Antonio, Birmingham, and Atlanta show page view premiums of 65% to 74%, well above the national average, pointing to latent demand that the current supply of listings isn’t meeting.
The South also stands out for large absolute price gaps: Birmingham multigenerational homes list at $539,000 versus $297,500 for standard homes (+81%), and San Antonio’s gap is comparable (+69%). While the absolute listing price difference in these Sun Belt metros is large, the price-per-square-foot premium is much smaller (+7.1% and +19.9%, respectively), suggesting that some of the price difference is due to home size, hinting that multigenerational listings in these fast-growing metros skew toward larger properties.
Methodology
Data sources: ACS 1-Year Estimates and Realtor.com listing data. We define multigenerational households following the U.S. Census Bureau’s definition: those households containing three or more generations. For the purpose of the research, we focus on only owner-occupied households.
To isolate trends in multigenerational housing, we filtered the 2025 active listing database for for-sale single-family homes and condos, excluding rental properties, pending sales, and deleted records. This ensured our analysis reflects only competitive, verified inventory.
We employed a keyword-based classification model to categorize inventory into “multigenerational” and “standard” segments. By scanning property descriptions for identifiers such as “ADU,” “guest house,” “in-law suite,” and “granny flat,” we successfully isolated properties marketed for multihousehold living from the broader universe of for-sale homes.
Finally, we aggregated performance metrics across 50 major metropolitan statistical areas (CBSAs) and the national aggregate. By calculating median list prices, price per square foot, days on the market, and listing page views, we provided a comparative benchmark to quantify the valuation and demand differences between multigenerational and standard property segments.
50 Largest Metros: Multigenerational Listing Data
| Geo Name | Share Multigen Listings | Multigen Listing Price | Price vs. Standard | Multigen Page Views vs. Standard | Multigen Listing Price per Sq. Ft. | Price per Sq. Ft. vs. Standard |
| United States | 6.1% | $709,000 | 64.9% | 13.5% | $262 | 21.9% |
| Atlanta-Sandy Springs-Roswell, GA | 10.7% | $608,000 | 44.1% | 30.0% | $189 | -1.0% |
| Austin-Round Rock-San Marcos, TX | 7.7% | $775,000 | 55.0% | 33.3% | $291 | 21.8% |
| Baltimore-Columbia-Towson, MD | 8.9% | $744,900 | 38.0% | 9.4% | $239 | -2.8% |
| Birmingham, AL | 3.4% | $539,000 | 81.2% | 73.7% | $166 | 7.1% |
| Boston-Cambridge-Newton, MA-NH | 7.0% | $1,099,900 | 15.9% | -0.9% | $375 | -12.4% |
| Buffalo-Cheektowaga, NY | 2.5% | $524,900 | 94.4% | 34.2% | $191 | 4.9% |
| Charlotte-Concord-Gastonia, NC-SC | 4.4% | $635,000 | 38.1% | 13.0% | $221 | 0.5% |
| Chicago-Naperville-Elgin, IL-IN | 3.7% | $587,990 | 51.2% | 30.6% | $212 | 5.5% |
| Cincinnati, OH-KY-IN | 2.4% | $599,999 | 64.8% | 40.3% | $196 | 3.7% |
| Cleveland, OH | 3.1% | $524,900 | 106.7% | 77.6% | $162 | 11.0% |
| Columbus, OH | 3.3% | $649,000 | 70.8% | 48.8% | $207 | 2.0% |
| Dallas-Fort Worth-Arlington, TX | 5.6% | $650,000 | 51.2% | 48.6% | $222 | 9.9% |
| Denver-Aurora-Centennial, CO | 9.6% | $850,000 | 23.4% | 6.3% | $287 | 1.1% |
| Detroit-Warren-Dearborn, MI | 2.0% | $550,000 | 120.0% | 82.0% | $208 | 20.9% |
| Hartford-West Hartford-East Hartford, CT | 5.3% | $699,000 | 40.1% | -3.0% | $256 | -1.5% |
| Houston-Pasadena-The Woodlands, TX | 2.9% | $520,000 | 38.7% | 50.0% | $189 | 8.6% |
| Indianapolis-Carmel-Greenwood, IN | 3.2% | $524,900 | 61.5% | 43.8% | $161 | 3.2% |
| Jacksonville, FL | 6.2% | $619,000 | 42.3% | 33.3% | $251 | 11.6% |
| Kansas City, MO-KS | 2.7% | $580,000 | 45.0% | 56.3% | $182 | -6.7% |
| Las Vegas-Henderson-North Las Vegas, NV | 4.7% | $699,999 | 27.3% | 10.0% | $261 | -5.1% |
| Los Angeles-Long Beach-Anaheim, CA | 23.7% | $1,419,800 | 1.6% | -11.1% | $692 | -0.3% |
| Louisville/Jefferson County, KY-IN | 2.8% | $550,000 | 69.2% | 36.2% | $164 | -8.4% |
| Memphis, TN-MS-AR | 2.7% | $579,000 | 69.8% | 52.5% | $161 | 1.3% |
| Miami-Fort Lauderdale-West Palm Beach, FL | 6.5% | $1,200,000 | 51.9% | 5.3% | $467 | 10.9% |
| Milwaukee-Waukesha, WI | 1.5% | $695,000 | 73.8% | 36.6% | $203 | -7.3% |
| Minneapolis-St. Paul-Bloomington, MN-WI | 3.5% | $699,000 | 33.2% | 26.6% | $210 | -5.8% |
| Nashville-Davidson–Murfreesboro–Franklin, TN | 6.8% | $830,000 | 44.4% | 31.0% | $292 | 12.3% |
| New York-Newark-Jersey City, NY-NJ | 5.7% | $899,000 | 7.3% | 10.6% | $365 | -21.7% |
| Oklahoma City, OK | 3.4% | $515,000 | 60.9% | 66.7% | $180 | 4.7% |
| Orlando-Kissimmee-Sanford, FL | 8.7% | $659,000 | 37.3% | 35.0% | $242 | 2.1% |
| Philadelphia-Camden-Wilmington, PA-NJ-DE-MD | 7.4% | $699,000 | 39.8% | 7.5% | $245 | 0.0% |
| Phoenix-Mesa-Chandler, AZ | 8.2% | $640,000 | 20.8% | 30.0% | $283 | 5.6% |
| Pittsburgh, PA | 2.8% | $409,900 | 78.3% | 27.7% | $175 | 10.8% |
| Portland-Vancouver-Hillsboro, OR-WA | 12.6% | $849,900 | 28.8% | 16.7% | $297 | -6.3% |
| Providence-Warwick, RI-MA | 6.5% | $775,000 | 24.0% | -3.5% | $300 | -11.8% |
| Raleigh-Cary, NC | 6.2% | $719,000 | 51.4% | 44.4% | $237 | 7.2% |
| Richmond, VA | 5.9% | $649,500 | 44.3% | 24.6% | $212 | -5.8% |
| Riverside-San Bernardino-Ontario, CA | 14.9% | $718,000 | 19.7% | 16.7% | $335 | -1.5% |
| Sacramento-Roseville-Folsom, CA | 14.6% | $749,990 | 17.9% | 11.9% | $343 | -0.6% |
| Salt Lake City-Murray, UT | 14.9% | $799,900 | 22.3% | 11.8% | $247 | 0.8% |
| San Antonio-New Braunfels, TX | 4.5% | $573,105 | 68.6% | 65.2% | $217 | 19.9% |
| San Diego-Chula Vista-Carlsbad, CA | 22.7% | $1,419,000 | 18.8% | -2.0% | $606 | -3.2% |
| San Francisco-Oakland-Fremont, CA | 17.4% | $1,299,000 | 8.4% | -5.8% | $670 | -0.4% |
| San Jose-Sunnyvale-Santa Clara, CA | 18.0% | $2,050,000 | 20.7% | 5.1% | $1,005 | 6.9% |
| Seattle-Tacoma-Bellevue, WA | 12.1% | $970,000 | 11.6% | 16.7% | $411 | -1.0% |
| St. Louis, MO-IL | 3.9% | $460,000 | 50.8% | 0.0% | $212 | 28.5% |
| Tampa-St. Petersburg-Clearwater, FL | 9.0% | $599,000 | 37.7% | 12.8% | $263 | 6.0% |
| Tucson, AZ | 8.4% | $524,990 | 26.5% | 32.1% | $251 | 9.6% |
| Virginia Beach-Chesapeake-Norfolk, VA-NC | 4.4% | $638,900 | 42.0% | 25.9% | $209 | -5.9% |
| Washington-Arlington-Alexandria, DC-VA-MD-WV | 10.9% | $925,000 | 27.6% | 4.7% | $271 | -5.6% |

